


Americans elected Donald Trump to a second presidential term in 2024 because he promised to make everyday products more affordable and most Americans better off.
It hasn’t worked out that way.
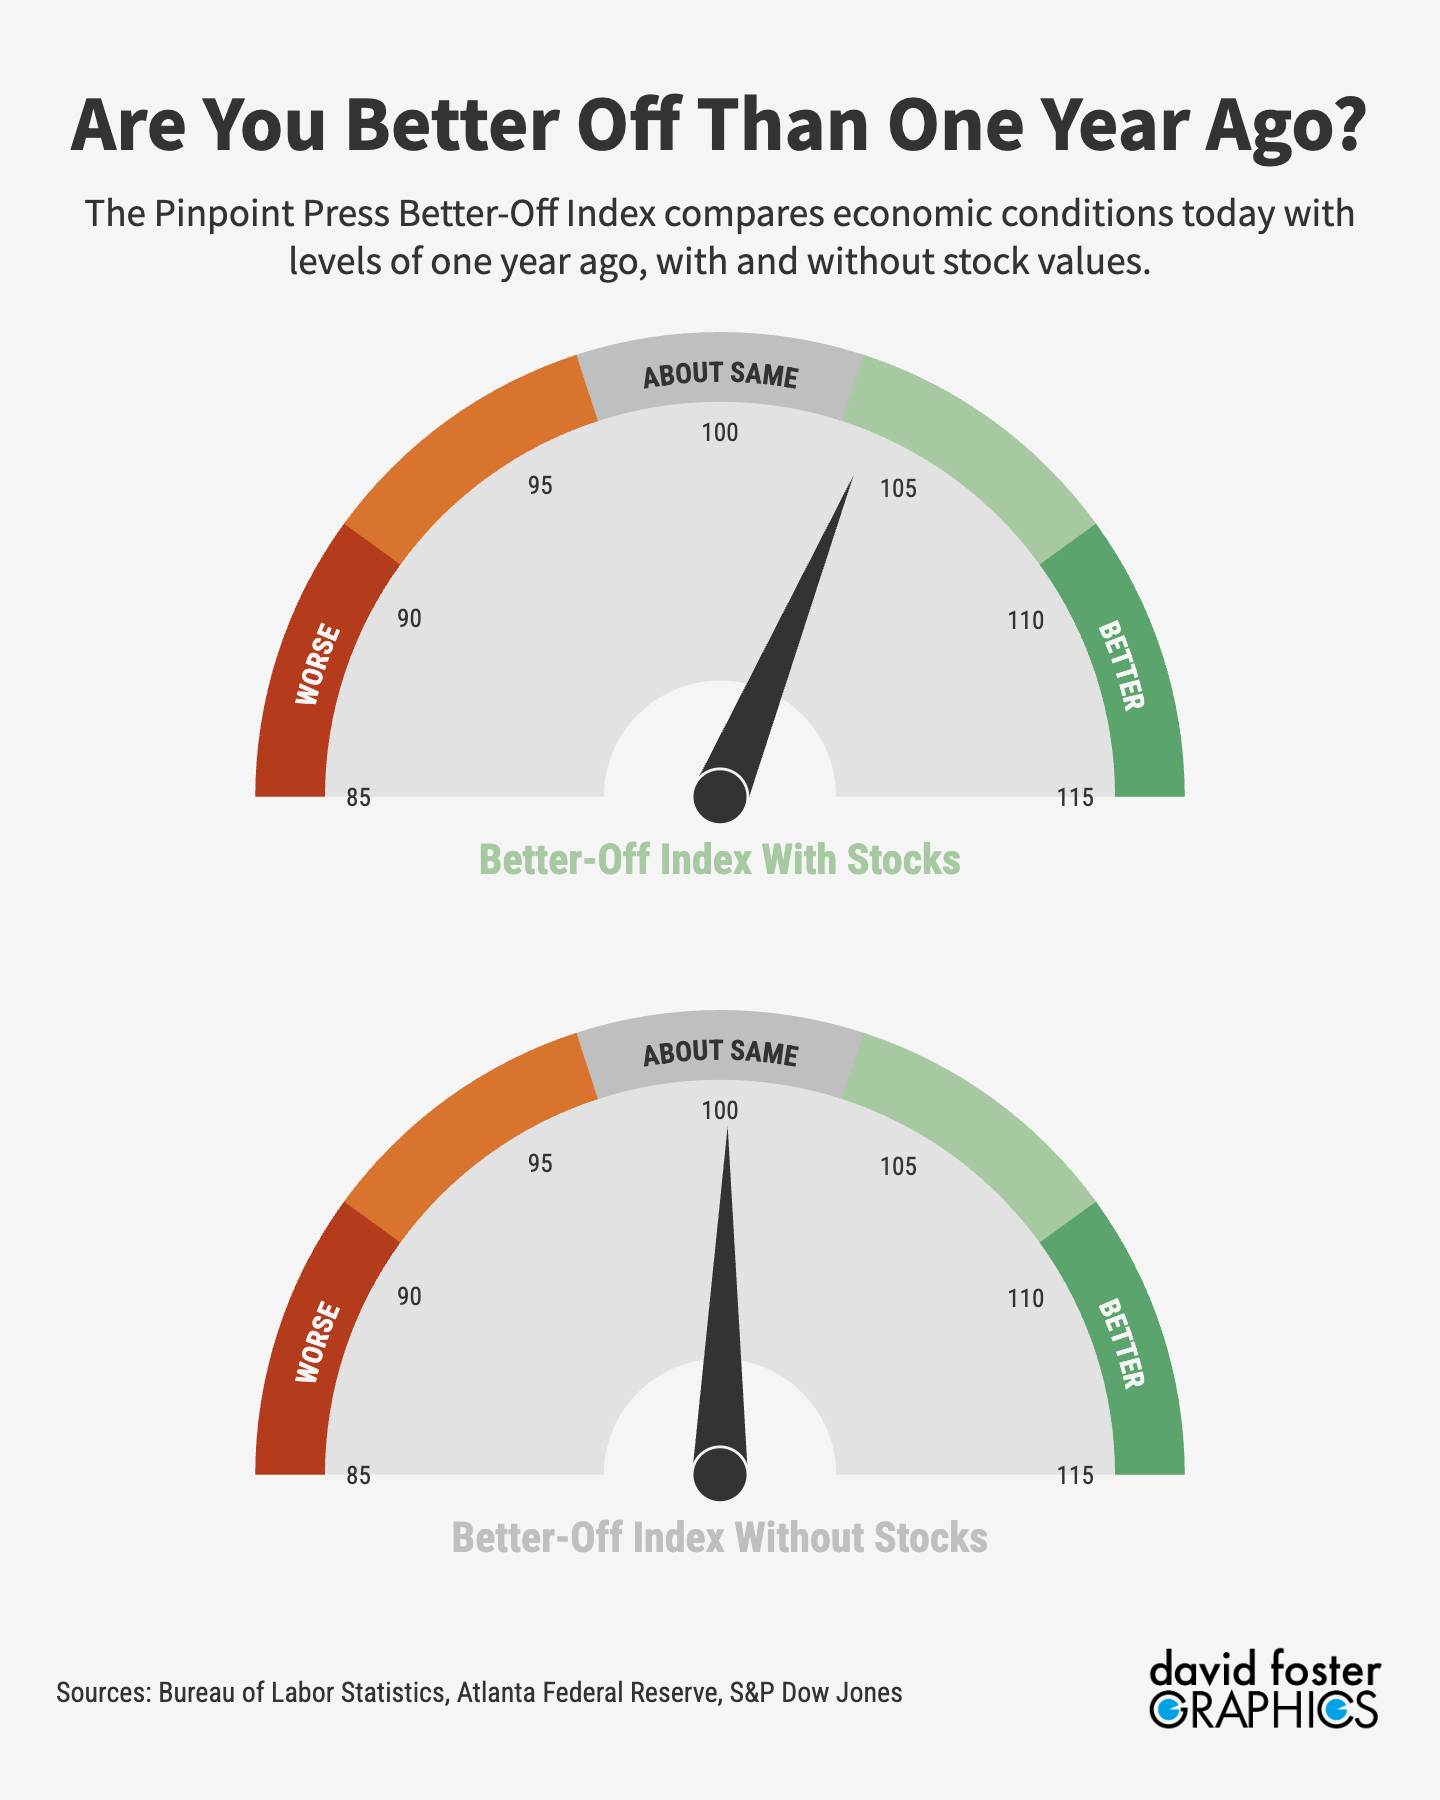
The Pinpoint Press Better-Off Index measures the year-over-year change in economic basics everybody can understand: job growth, real-income growth adjusted for inflation, home affordability, and stock values. It addresses a simple question many Americans ask themselves: Am I better off than I was one year ago? (Here’s the methodology.)
The answer is: Just barely. The Better-Off Index for October 2026 is 103.76, which means the conditions we measure, in the aggregate, are 3.8% above levels of October 2025.
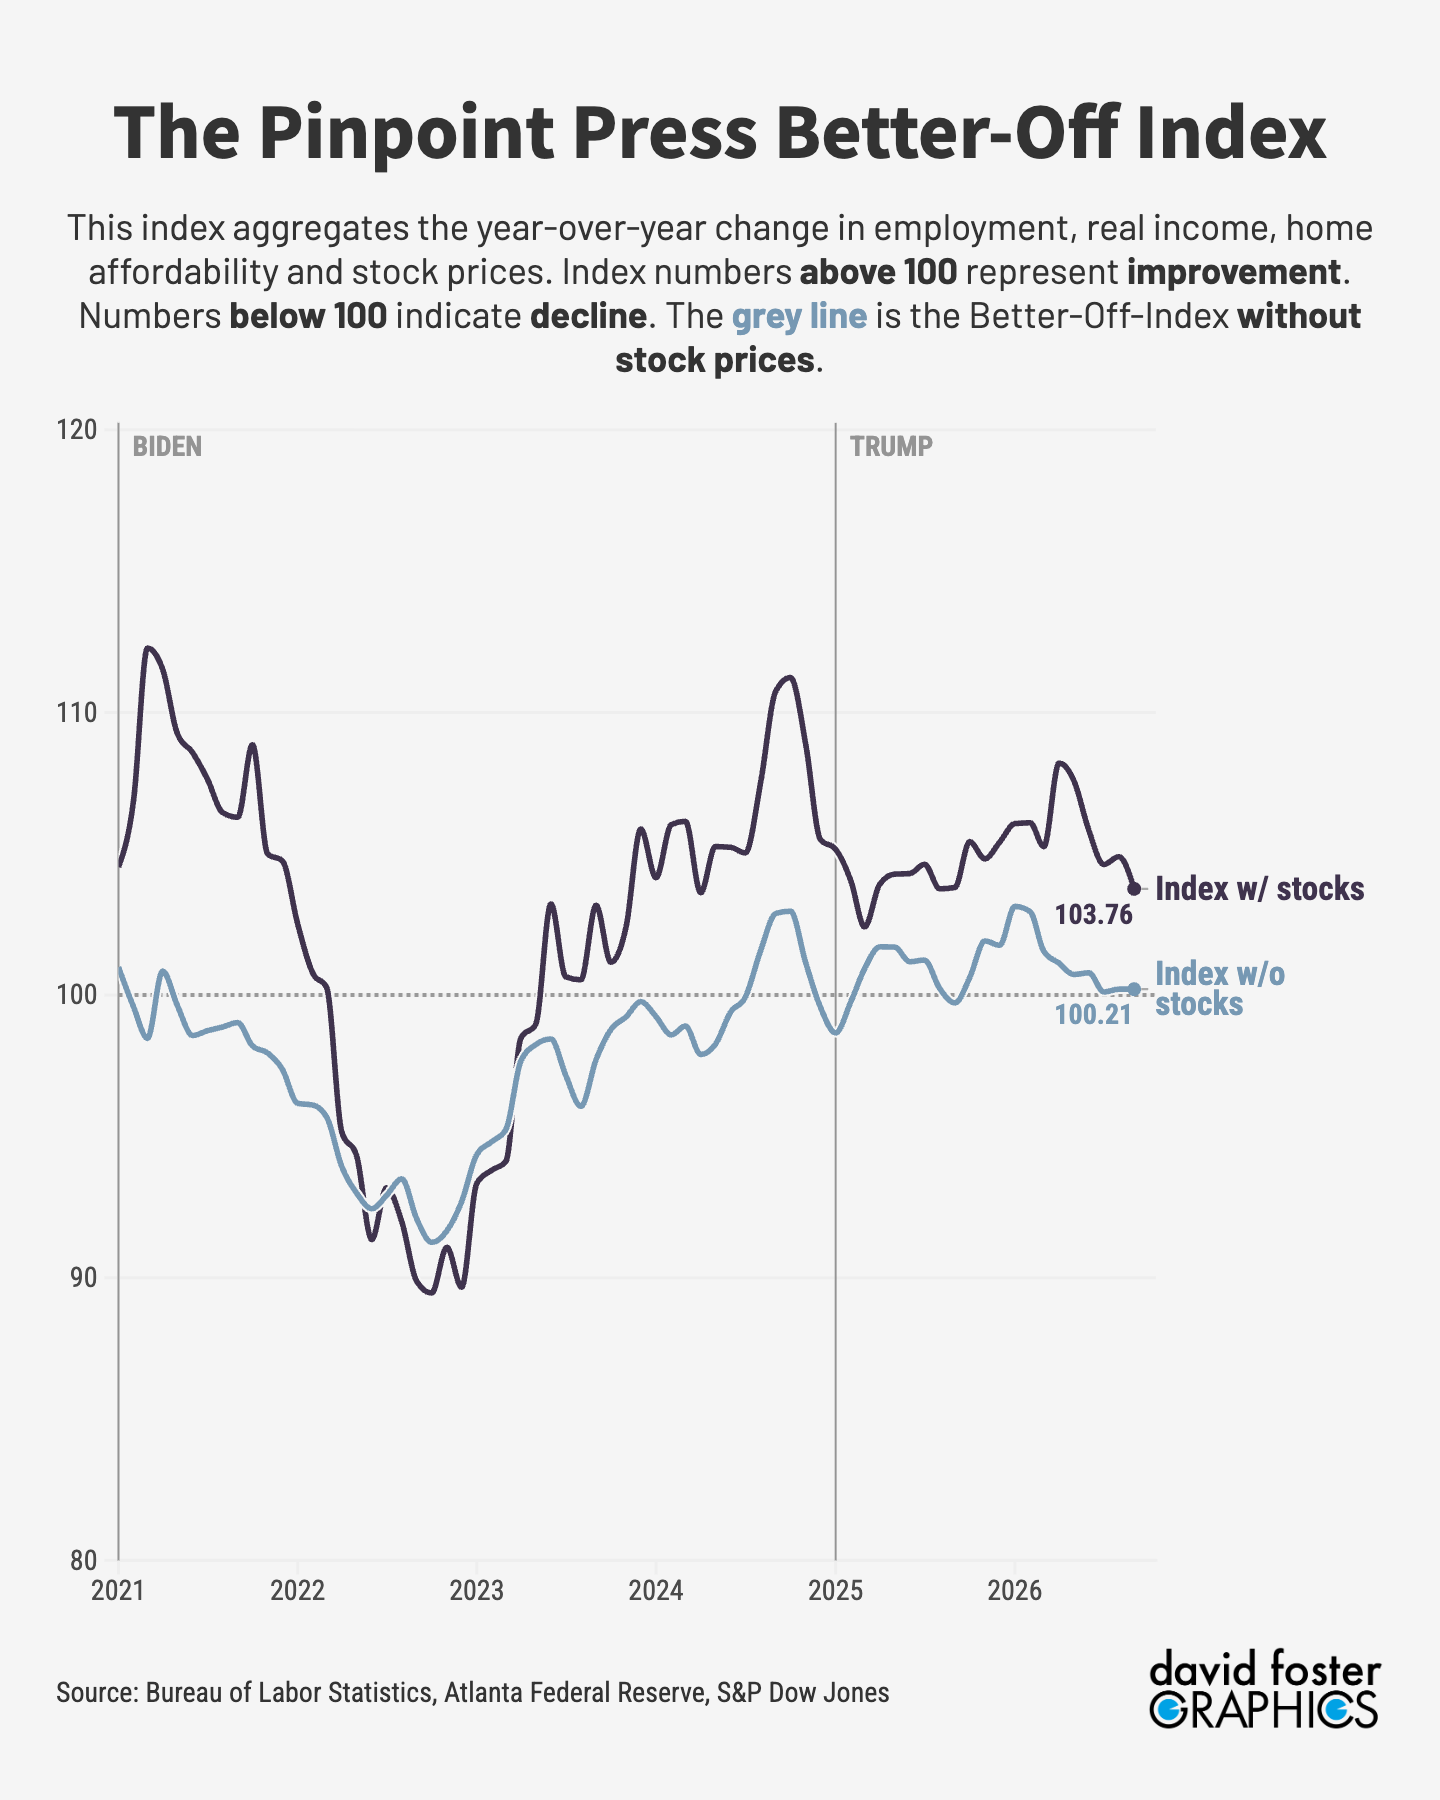
But when you remove stocks, the Better-Off Index is just 100.21, which is essentially no improvement at all. And for many Americans, keeping even isn’t nearly good enough.
Around 60 percent of Americans own stocks, mostly in retirement plans. With the stock market up 14% year-over-year, people lucky enough to have financial assets are wealthier. But most people with stocks don’t tap those assets for day-to-day living expenses. Only the wealthy use capital gains to finance their regular spending.
Nearly everyone else relies on a paycheck to pay the rent or mortgage, and buy groceries. And that’s where the pain is. Inflation has wrecked earning power. Job growth is far below the levels of the Biden presidency. Rising mortgage rates have made home affordability worse, not better.
Here’s the year-over-year change in each category we measure:
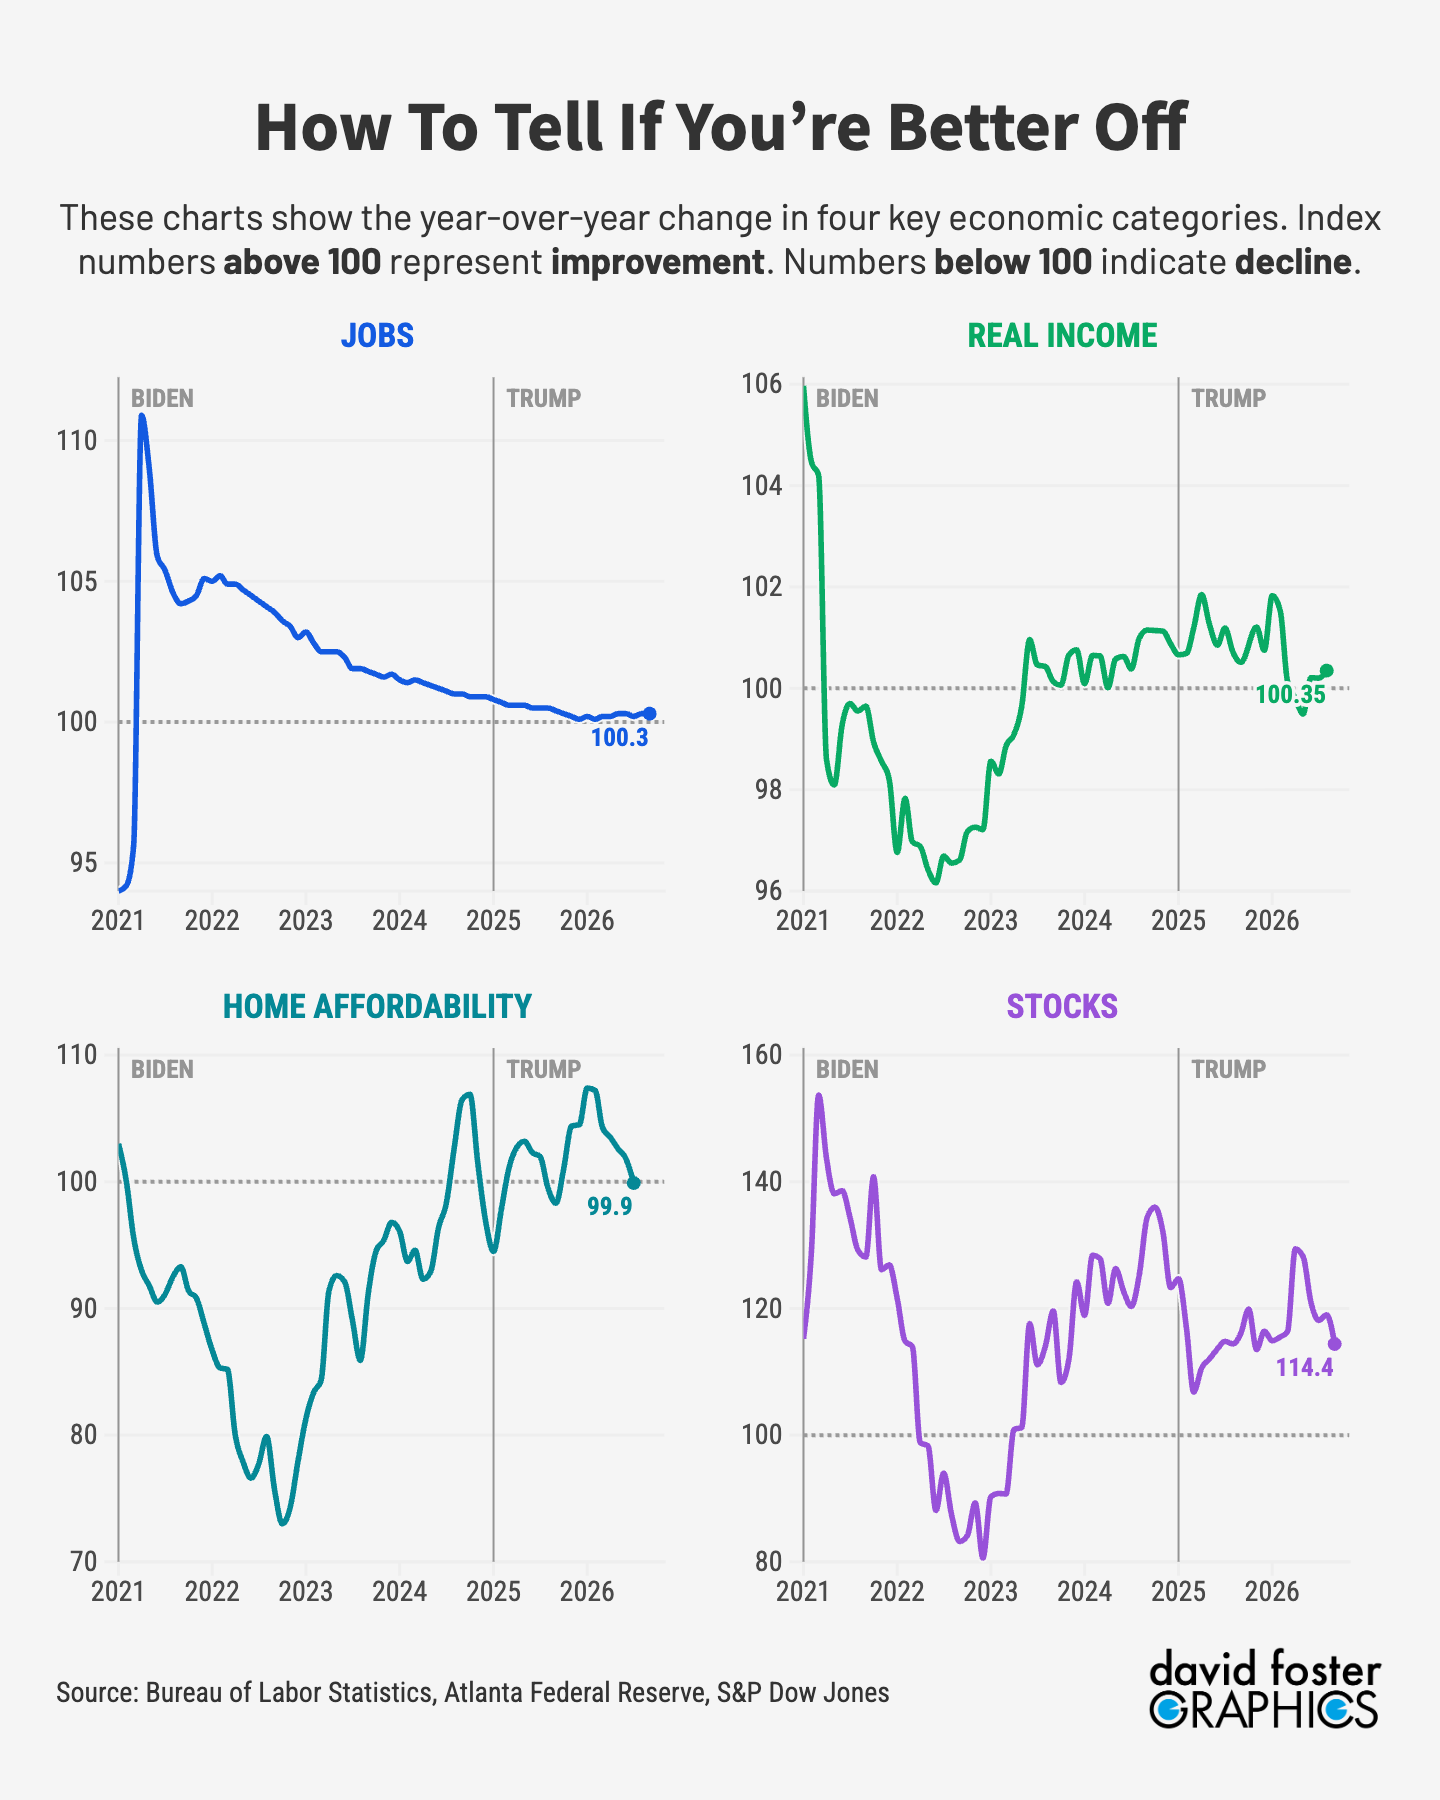
The unemployment rate is low, but weak job growth of just 0.3% during the last year is making workers uneasy. In the Conference Board’s latest confidence survey, the portion of respondents saying jobs are “plentiful” dropped to 23.6%, the lowest level since early 2021—which was the latter stage of the Covid pandemic.
[Why soaring rates aren’t a problem—yet]
We account for inflation by measuring real income, which is income adjusted for inflation. It’s up just 0.35% during the last year, or essentially flat. When purchasing power is flat, workers are not getting ahead. And feeling stuck does not endear voters to their elected leaders.
Home affordability has worsened slightly during the last year, based on data gathered by the Atlanta Federal Reserve that goes through July. Mortgage rates have jumped by about three-quarters of a point since then. That means real-time affordability is worse than the chart above shows, and that line is going to head lower as more data arrives.
Stocks have done well under Trump. But that’s mostly due to the artificial-intelligence buildout and the soaring performance of a small number of companies benefiting from it. The AI craze is propping up the economy and the stock market, but not broadly benefiting the majority of Americans.
Trump’s approval rating has cratered this year, as the Iran war he started in February caused a global energy crisis and sent the price of energy and many other products higher.
Trump’s terrible ratings are the main reason Democrats hope to make sweeping gains in the November midterm elections, likely winning control of the House and possibly the Senate.
[5 things to expect if Democrats win in November]
For historical perspective, the Better-Off Index was considerably higher during the last federal election in November 2024, when Trump beat incumbent Vice President Kamala Harris to win a second presidential term. The index then was 108.87, or more than 5 points higher than current levels. That represented an 8.9% improvement over conditions from one year earlier, compared with the 3.8% improvement now.
The takeaway for Trump is that even with modest year-over-year improvements in 2024, voters were frustrated enough to toss the incumbents and give Republicans complete control of the White House and Congress. Republicans have now performed worse than their predecessors. Voters will soon render their judgment.
Enjoy a cartoon.
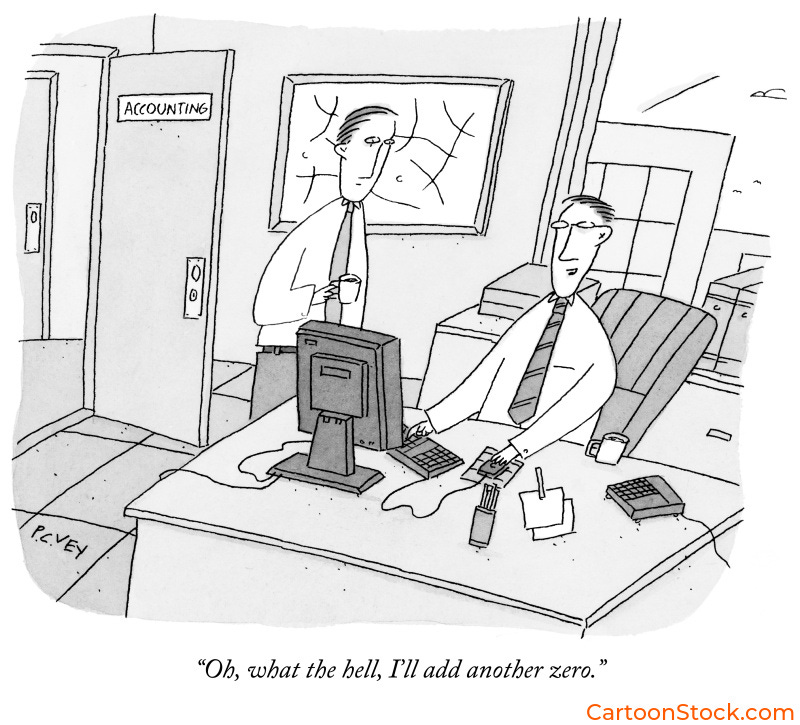
You can order this cartoon👆 and play cartoon-themed puzzles and word games at CartoonStock.com.