


With the midterm elections looming, President Trump’s handling of the economy is a central focus for voters. Many will vote Republican if they’re happy with the Trump economy, or Democratic if they’re not.
Republicans seem to be in trouble. Trump’s approval rating is near the lowest levels of either of his two terms. And he now gets the lowest marks of all on the economy and inflation.
How bad is the Trump economy, anyway? Our Trumponomics Dashboard answers the question with data and charts, and compares the Trump economy with that of other presidents. We track six key metrics using data provided by Moody’s Analytics: Overall employment, manufacturing employment, inflation, stock-market performance, income growth and GDP growth. David Foster provides the graphics and maintains an interactive version for anyone who wants to play around with the tabs. You can see the full methodology here.
[Explainer: Why AI might want to eliminate humanity]
Among the seven presidential terms of the 21st century, the current Trump economy ranks 5th. This is not a subjective ranking. We simply tally the numbers for each metric and aggregate them into one index that gives us this ranking.
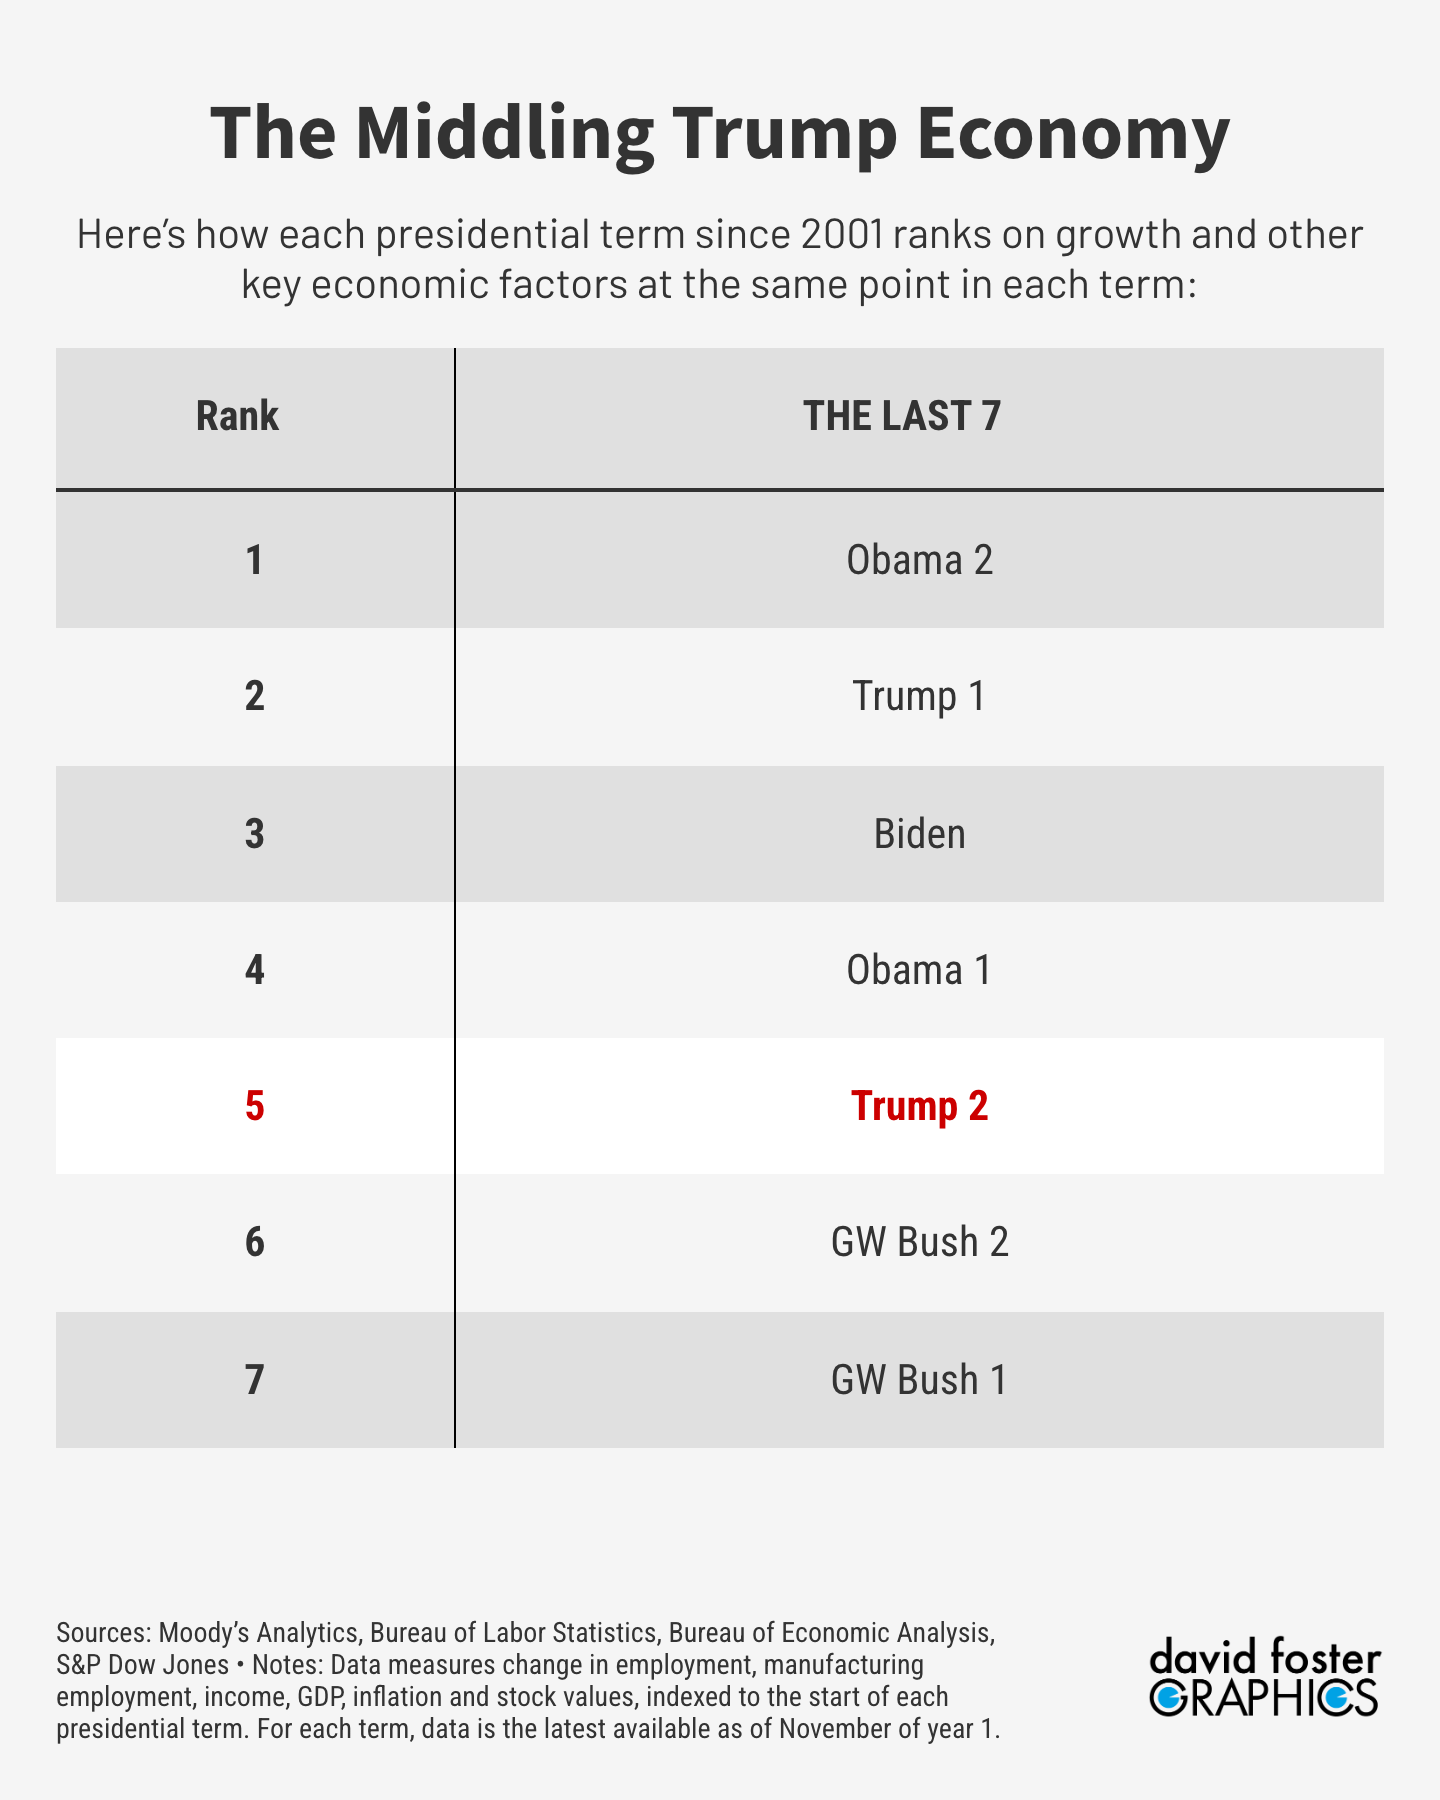
It’s not surprising that Obama’s second term and Trump’s first term represent the No. 1 and 2 spots. That covers the first 19 months of each presidential term, from 2013 to 2014 and from 2017 to 2018. That was a period of steady improvement in the economy following the Great Recession in 2008 and 2009. Inflation was low and energy was cheap, thanks to the fracking revolution that was picking up steam. Trump won reelection in 2024 because many voters recalled his first term as a time of relative prosperity (before the Covid pandemic erupted in 2020). The numbers support that view.
Trump’s second term is a comedown from his first. Here’s how the current Trump economy ranks on each of the six areas we follow, compared with the six prior presidential terms.
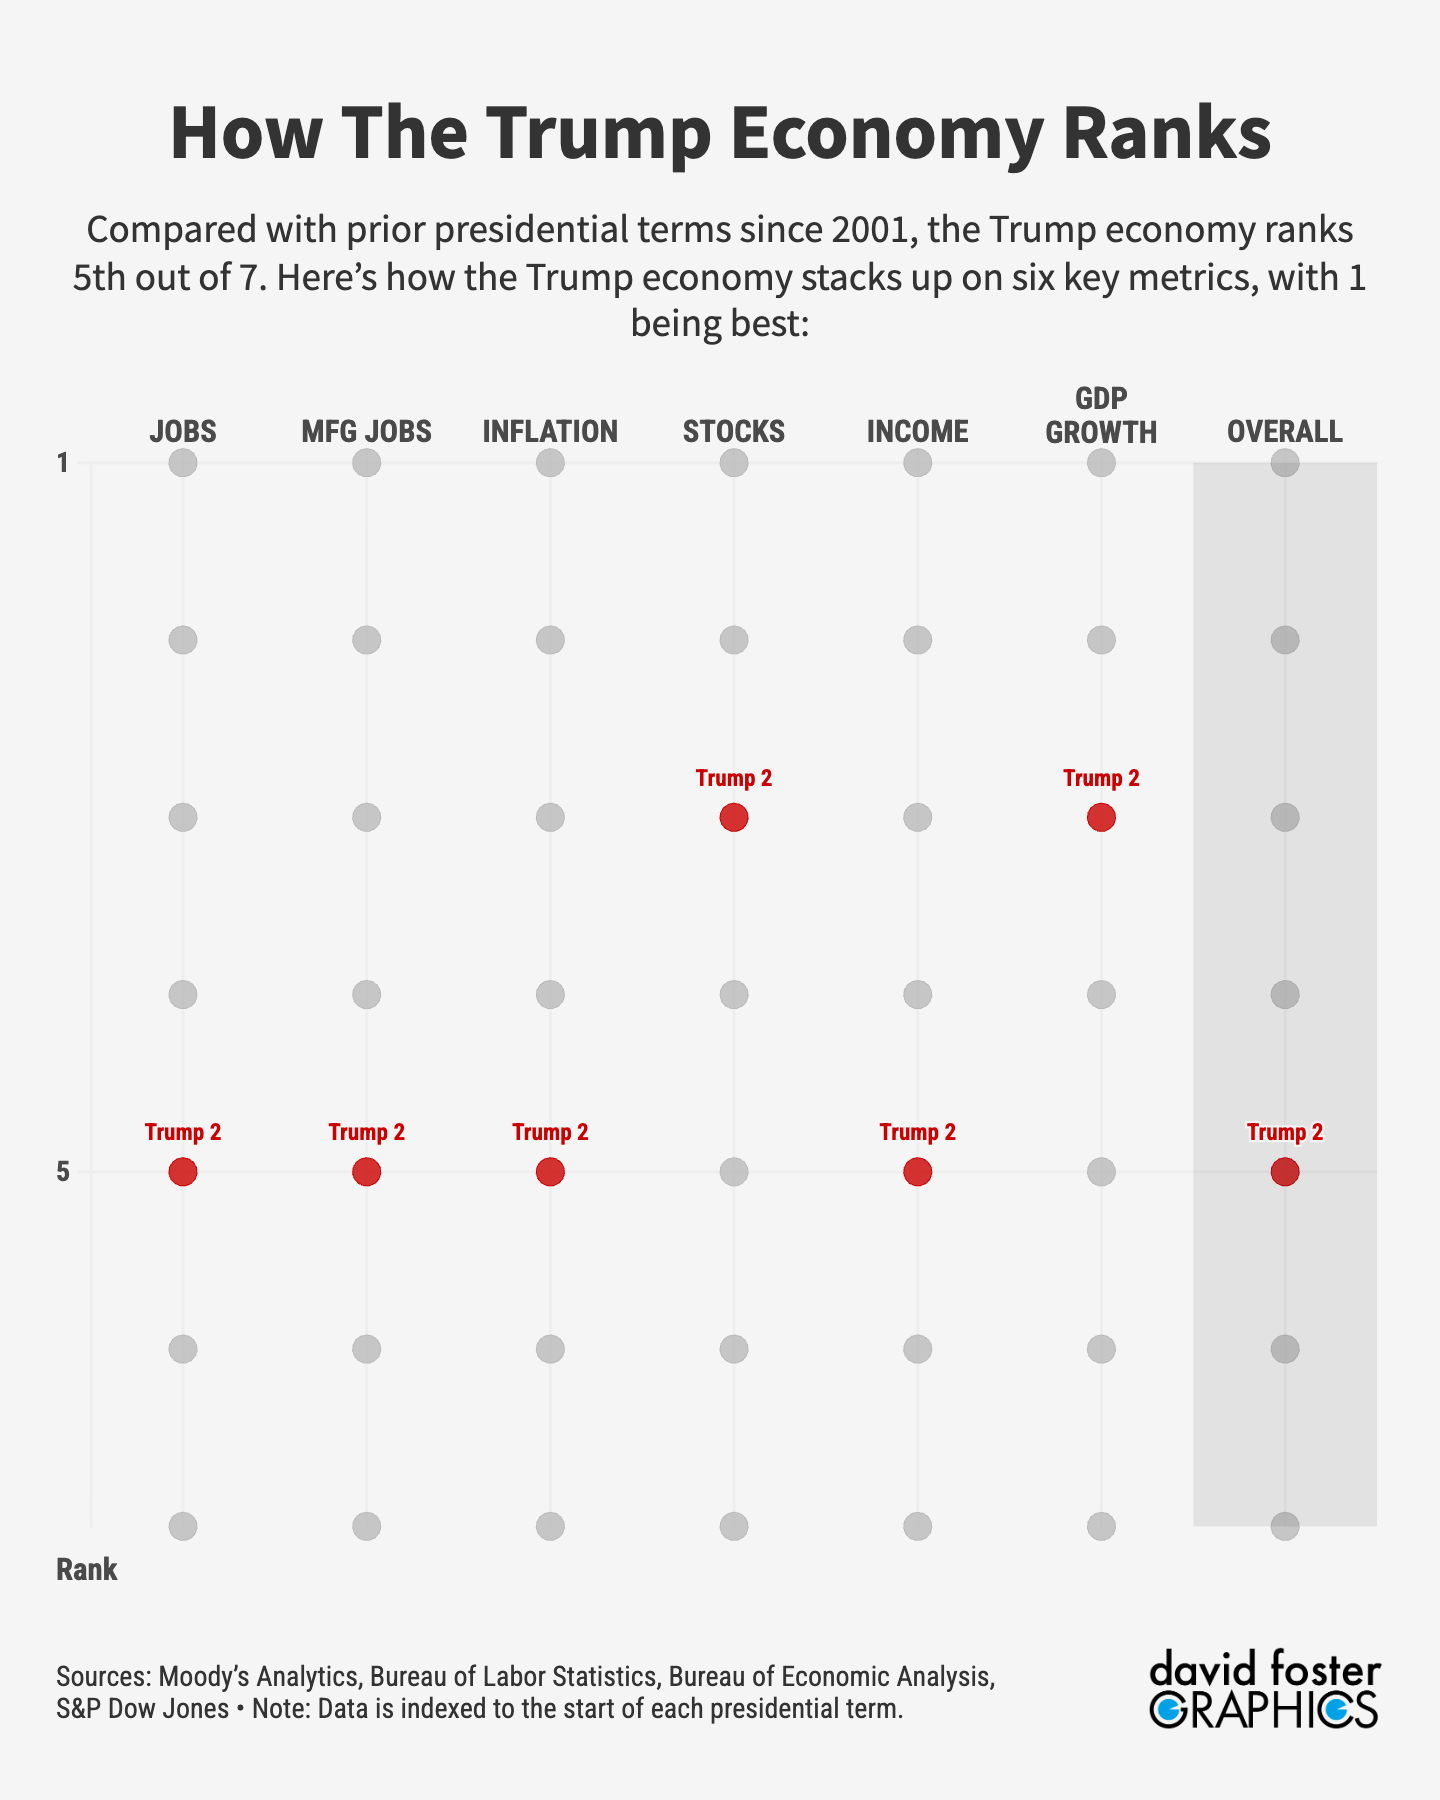
Stock-market gains and GDP growth have been above average during Trump’s second term, while everything else has been below average.
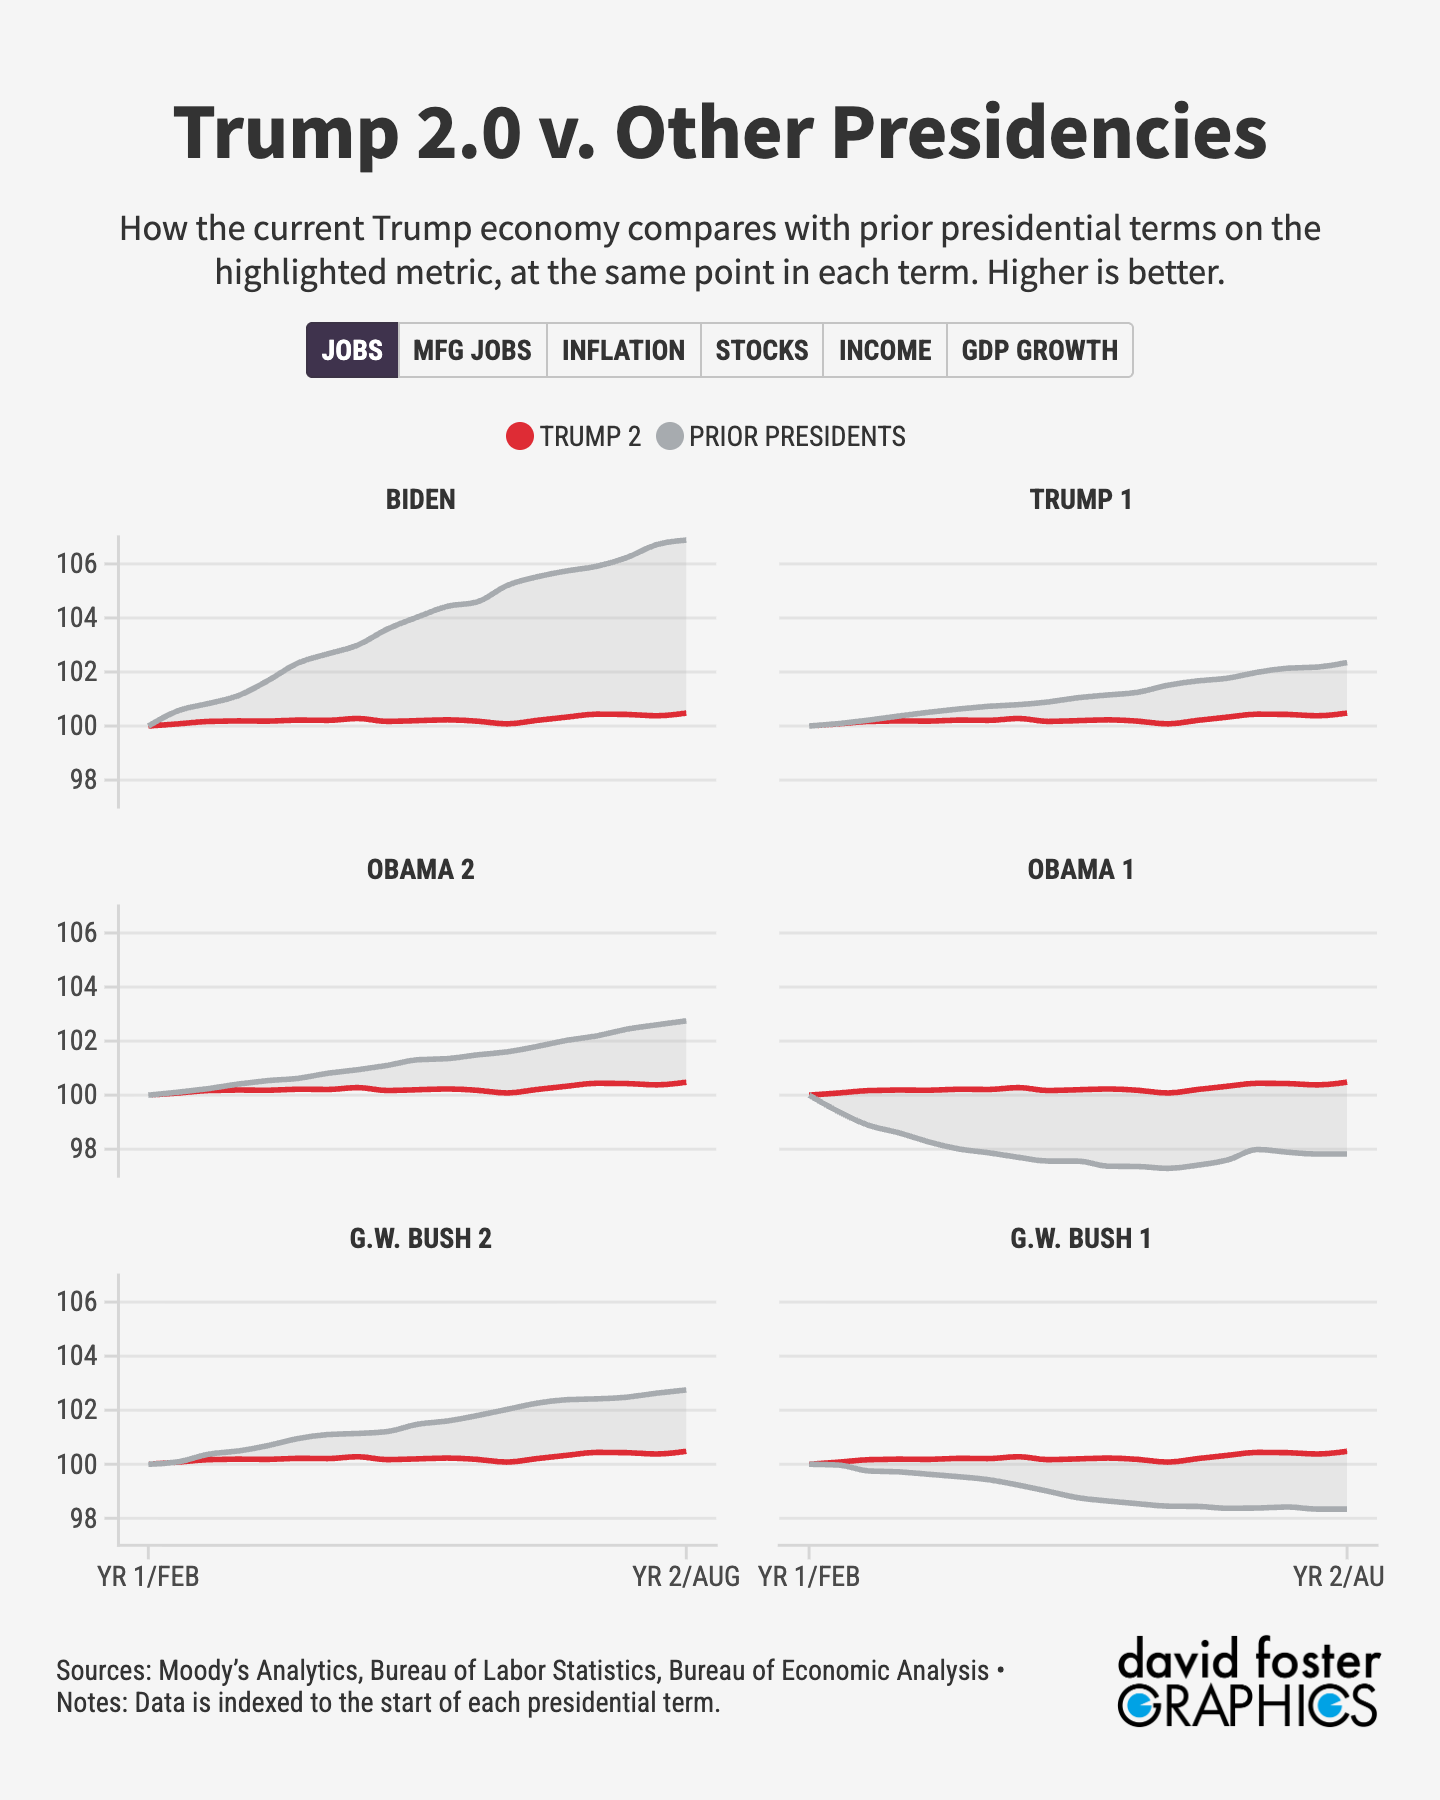
The next set of charts compares the Trump economy with each of the prior presidential terms on the metric that’s highlighted. Trump is in red, with the other presidential terms in gray.
[An epic Trumpstorm is coming]
Job growth under Trump has been fairly weak, probably because of his aggressive deportation policies and other efforts to reduce legal immigration. If there are fewer migrants, there are fewer workers.
Trump’s tariffs are supposed to create more manufacturing jobs by making imports more expensive and encouraging more domestic production. But there’s been no notable improvement in manufacturing jobs under Trump.