

These 8 charts explain the wartime stock-market rally
Wondering how stocks can rise amid war and soaring oil prices? Here's how.

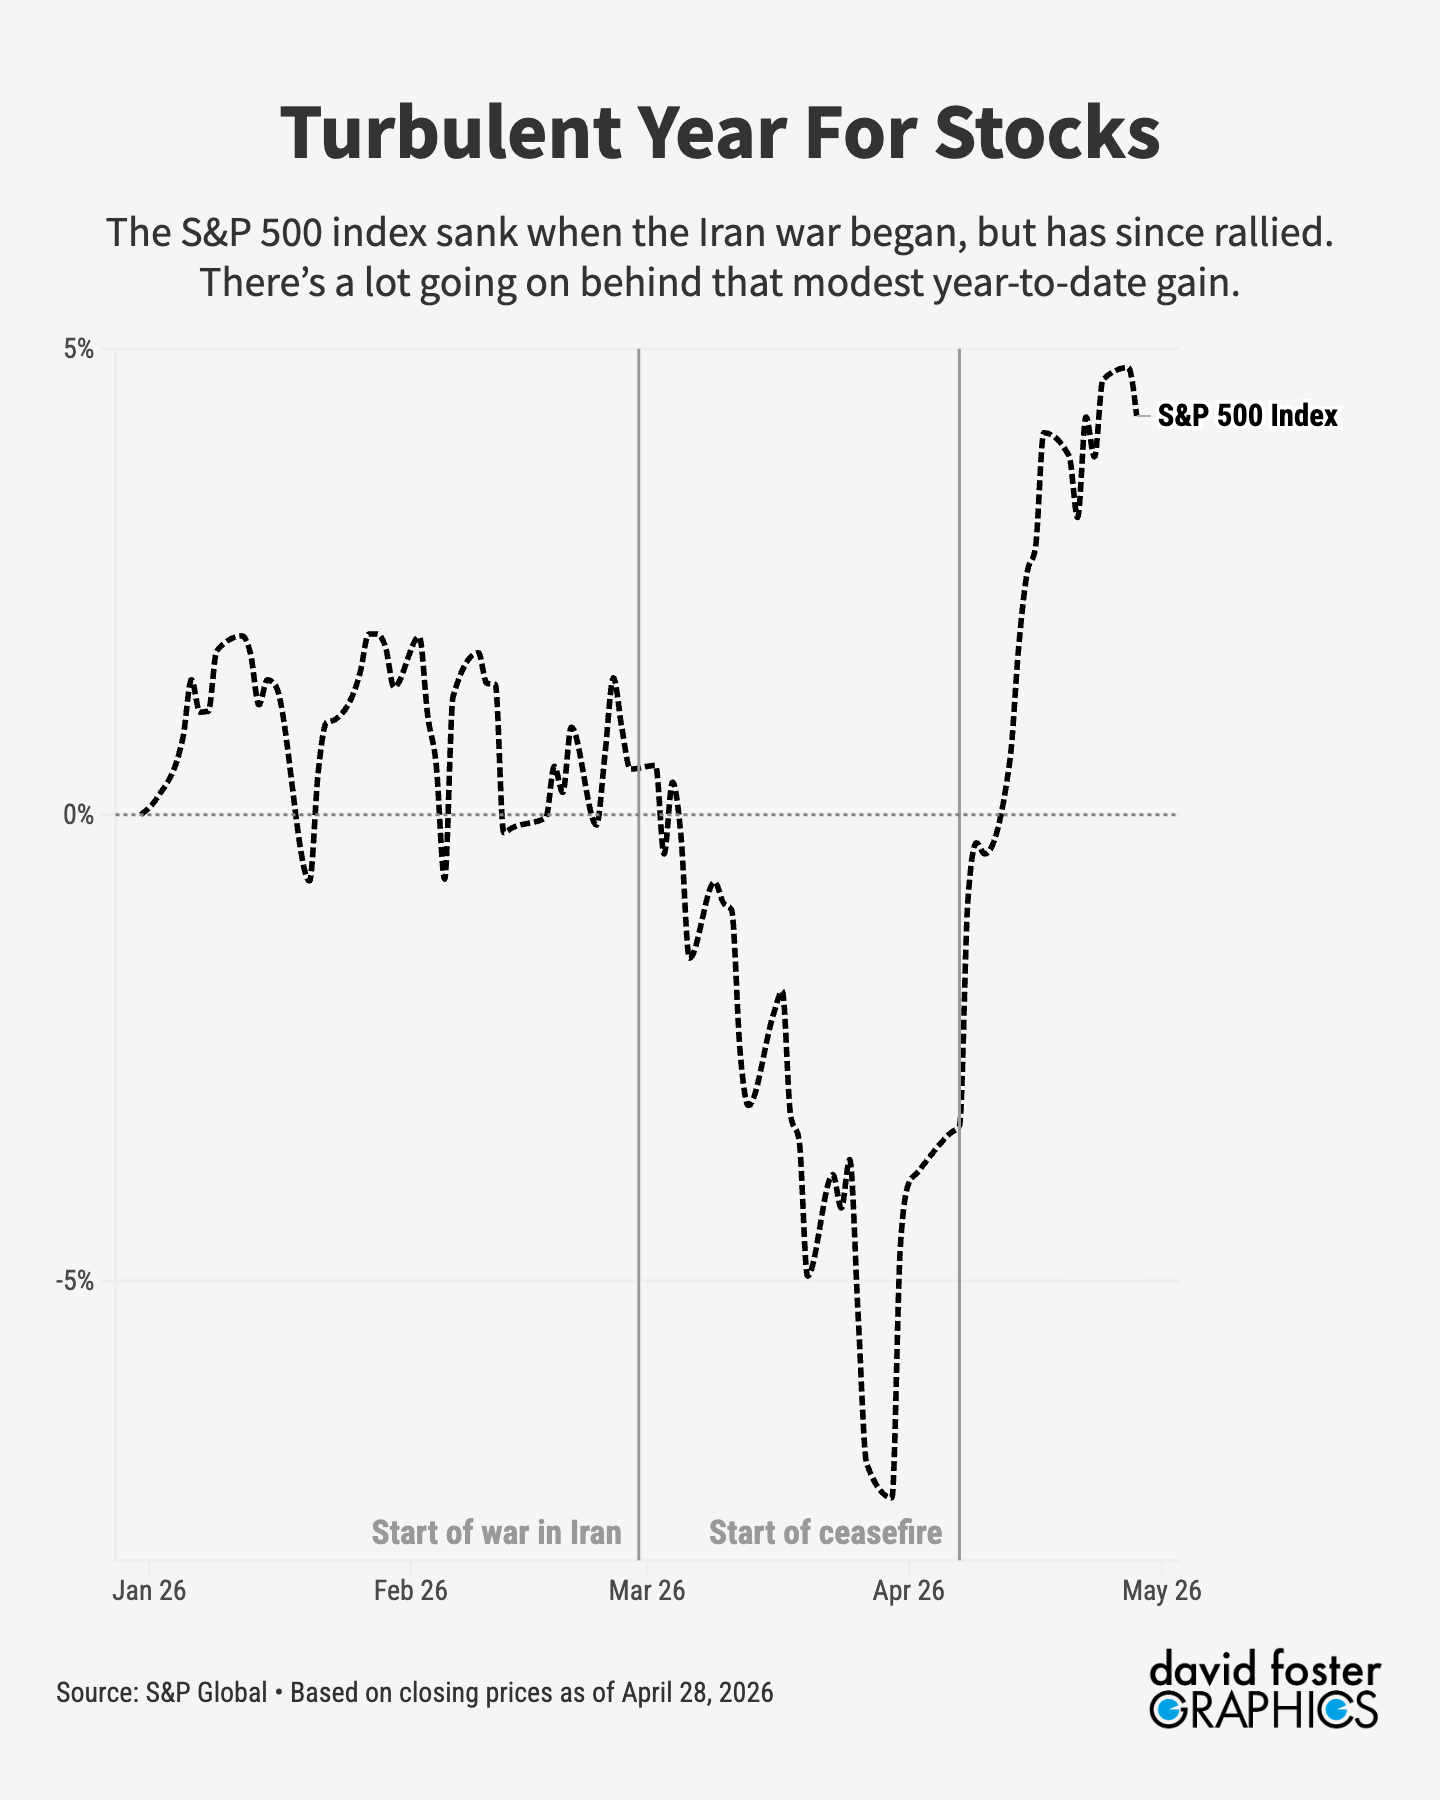
It’s becoming a remarkable year for the US stock market. The Iran war President Trump launched on February 28 caused a global energy shock that sent stocks into a month-long slide. That’s what you’d expect from an open-ended war that jacked up energy costs everywhere and injected massive amounts of uncertainty into markets.
During April, however, stocks staged a surprise rally that erased those wartime losses and turned stocks positive for the year. The S&P 500 index is now up about 4.5% in 2026, with a few sectors up by a lot more.
Some analysts don’t understand how stocks can blow off a global energy shock that’s raising costs for most companies, damaging consumer purchasing power and depressing growth. It could be that markets are too sanguine and stocks will drop anew.
But it’s also true that investors think huge gains lie ahead for the beneficiaries of artificial intelligence, with or without a war. Views change about who those beneficiaries are likely to be. But for now, investors have decided that the risk of missing out on huge AI-related gains outweighs the economic damage caused by the war. The war effects will (probably) be temporary. The transformative effects of AI will be lasting.
A few intriguing charts show how the AI boom temporarily became a sidestory during the first few weeks of the war—then roared back to propel stocks to new highs.
First, here’s the S&P 500 index for 2026. It was up by a fraction—basically flat—when the war started on February 27. From the start of the war through March 30, the S&P 500 fell 7.8%. Since then, however, the S&P has jumped by nearly 13%.
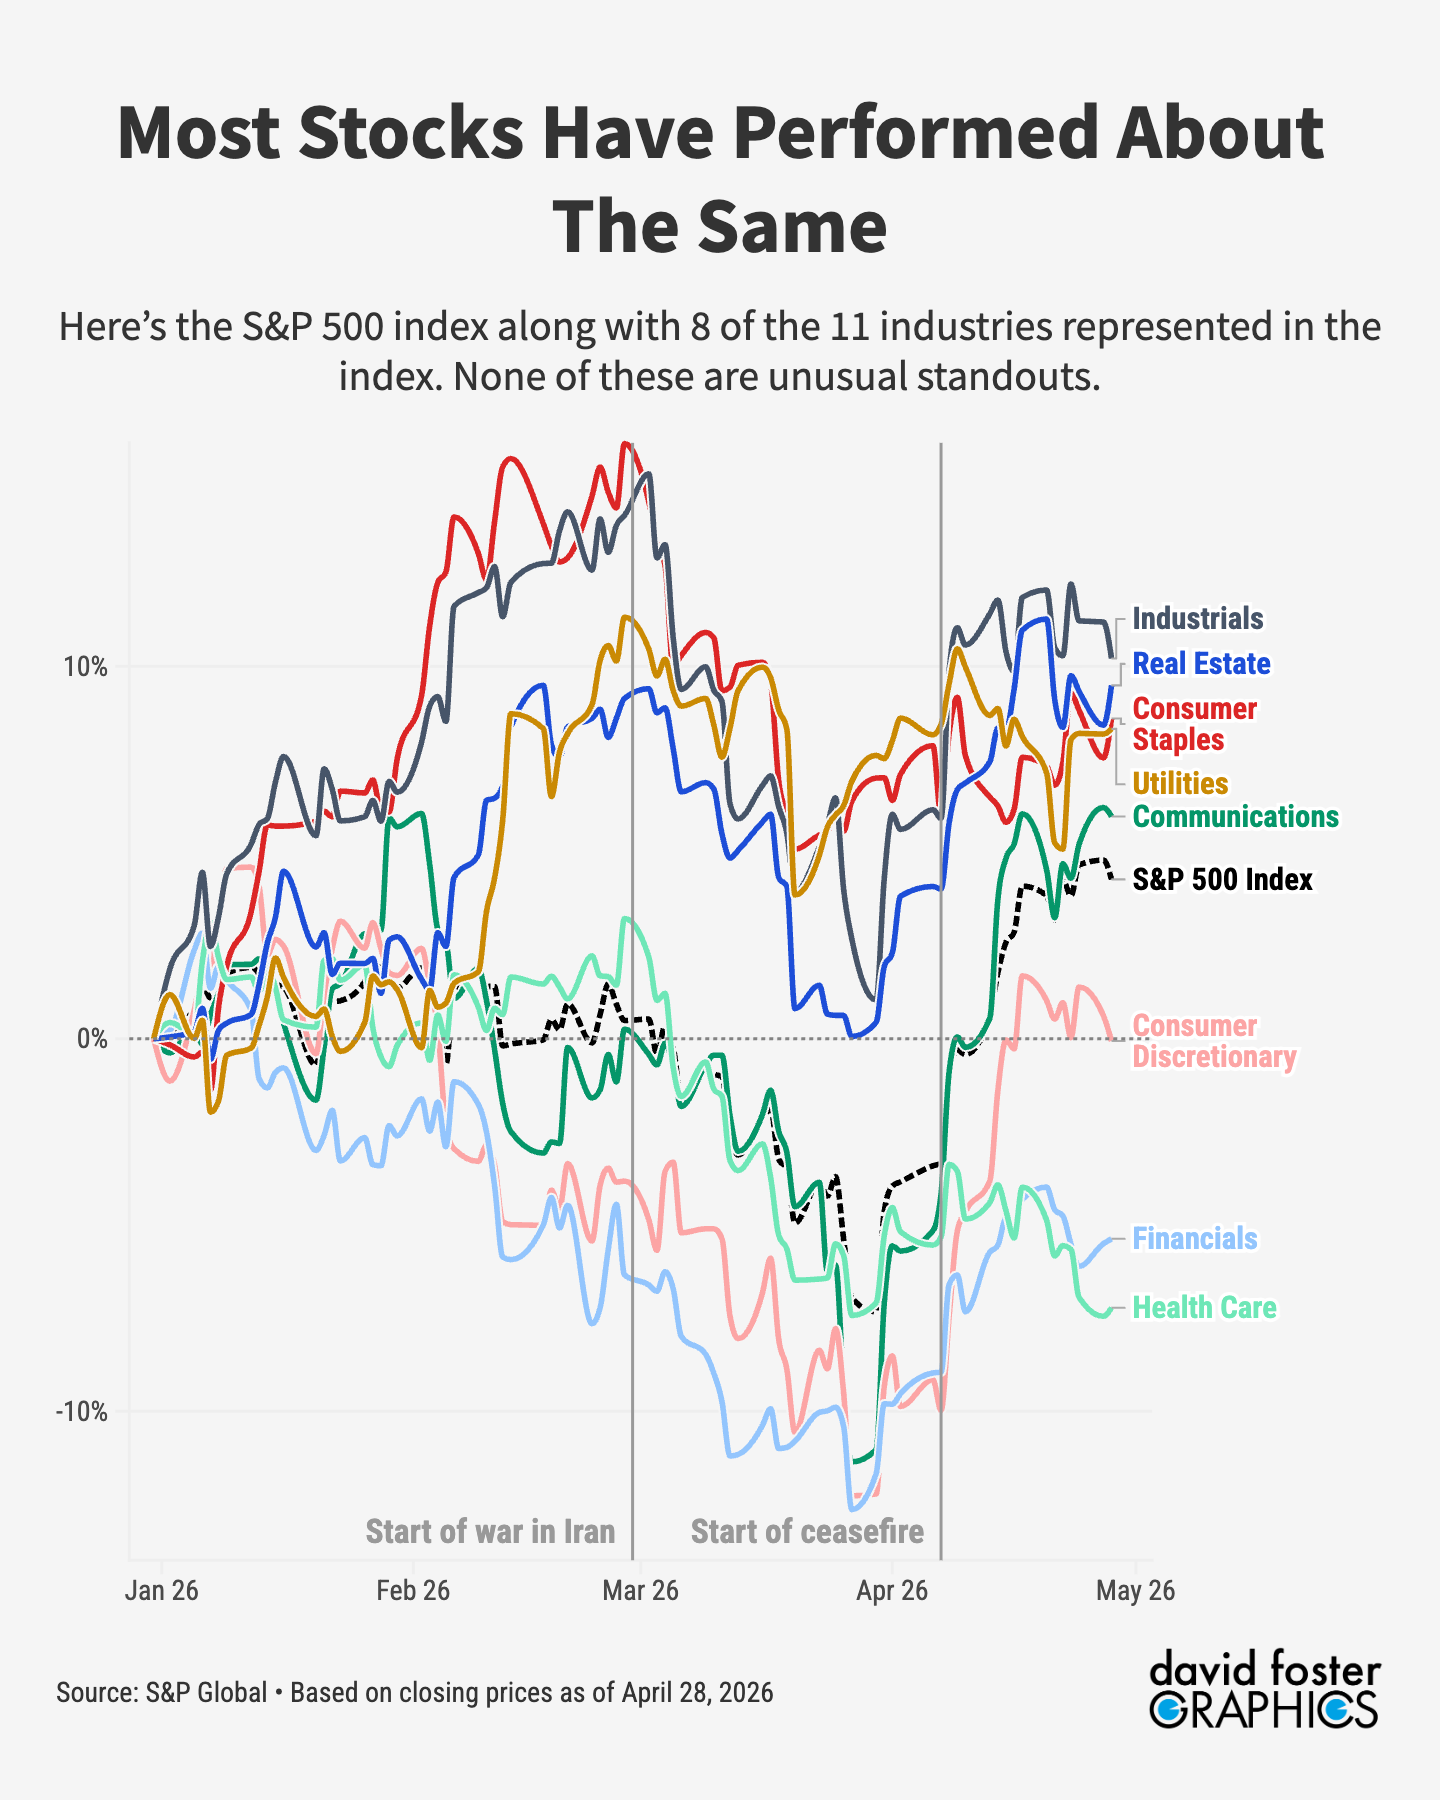
Stocks in most industries have followed the S&P. This chart shows eight of the 11 industries represented in the index: communications, consumer discretionary, consumer staples, financials, health care, industrials, real estate, and utilities. Nothing stands out, but that’s the point.
Now here’s the index with all eleven sectors. The additions include technology, materials, and energy. We’ve also added two subsectors, semiconductors and software, using the S&P Global subsector indexes. Ignore the muddle in the middle and focus on the standouts at the top and bottom.
Keep reading with a 7-day free trial
Subscribe to The Pinpoint Press, with Rick Newman to keep reading this post and get 7 days of free access to the full post archives.