

The Better-Off Index rises in February
The economy is slightly better off than it was a year ago, but that's not good enough for many voters.

Key takeaways: 😉
The Pinpoint Press Better-Off Index rose from 115.4 in January to 117.5 in February.
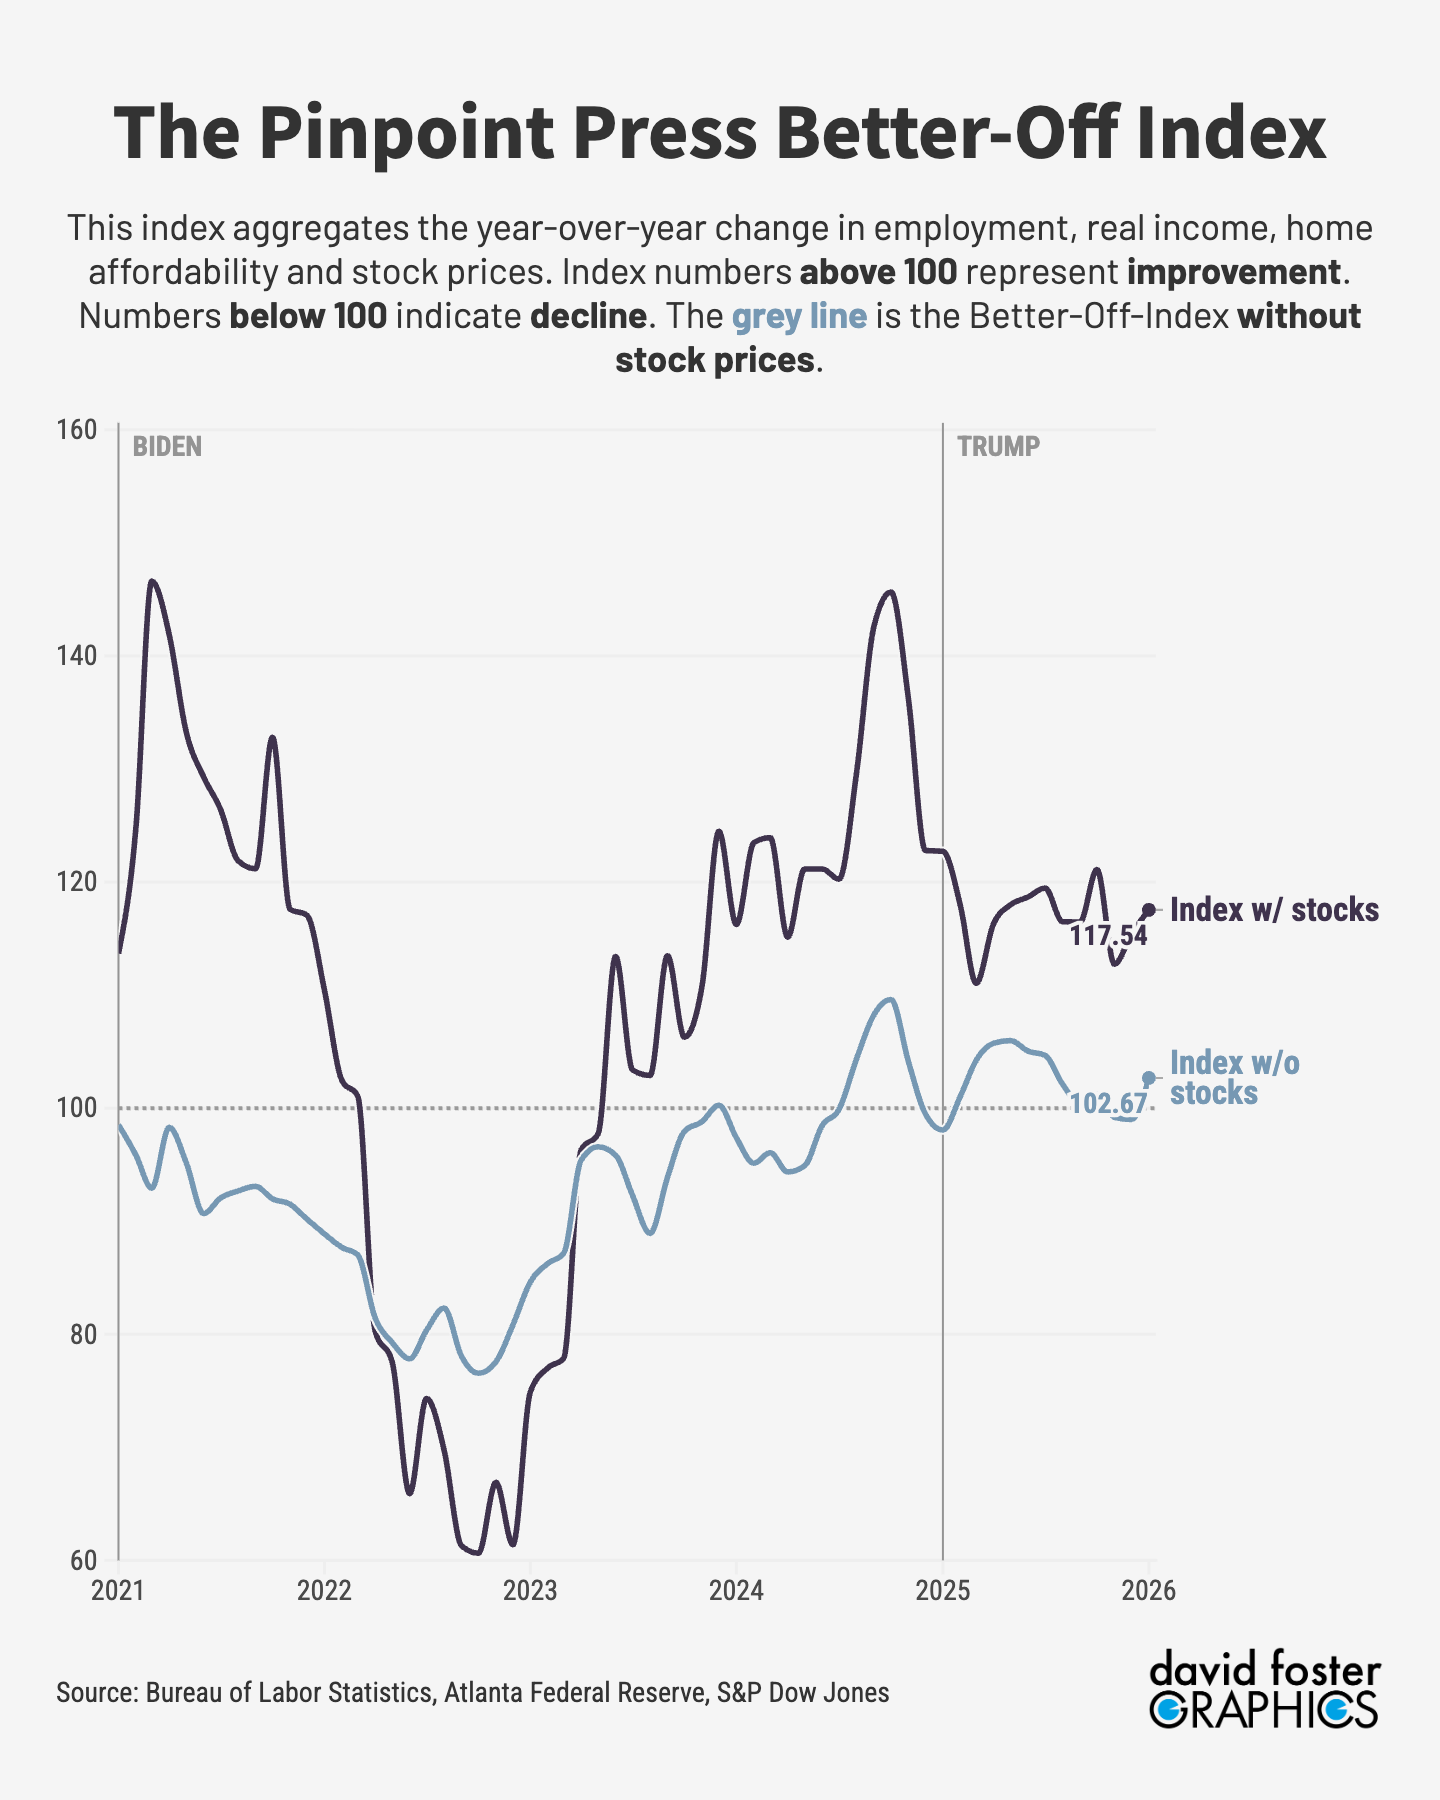
The Better-Off-Index measures the one-year change in employment, real income, home affordability and stock values.
A number over 100 indicates year-over-year improvement while a number below 100 indicates decline.
Most of the improvement during the last 12 months is due to rising stock values.
Employment and real income have barely improved. Home affordability is slightly better than one year ago but homes remain unaffordable in general.
These numbers help explain who’s up and who’s down in the K-shaped economy.
~ ~ ~ ~ ~ ~ ~ ~ ~
Slightly better home affordability pushed the Pinpoint Press Better-Off Index higher in February, though the index still carries warnings for President Trump.
The Better-Off Index rose from 115.4 in January to 117.5 in February. The index compares current levels of employment, real income, home affordability and stock values with those of one year ago, to measure whether ordinary Americans are getting ahead or falling behind. Any number over 100 indicates improvement. The current reading is slightly better than the average in data going back to 2006.
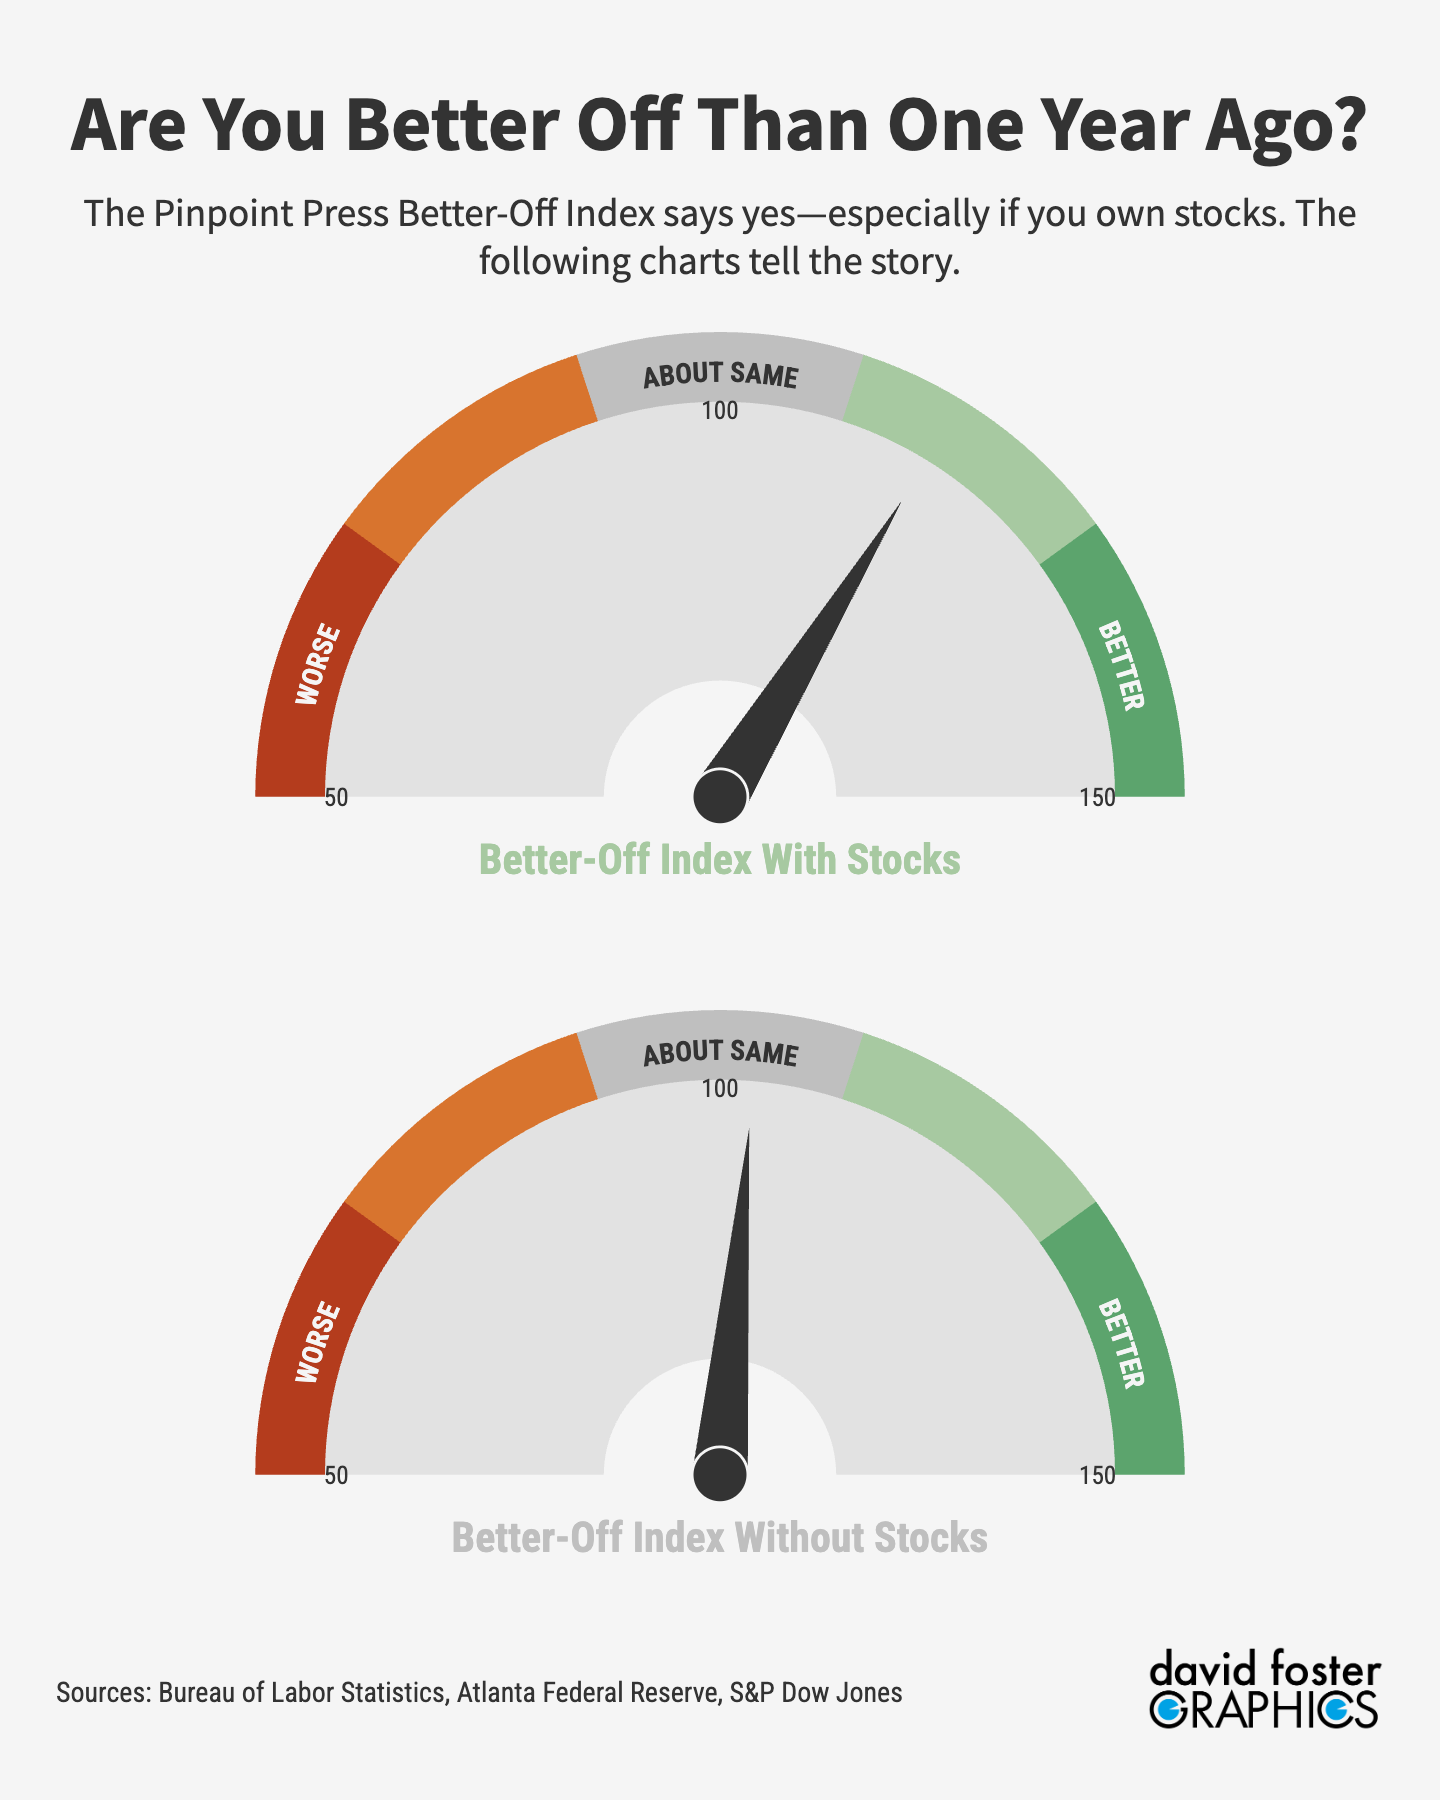
But most of the gain from one year ago is due to rising stock values, which means people who don’t own stocks are barely ahead of where they were one year ago. The Better-Off Index without stocks is 102.67—only a slight improvement compared with February 2025.
Analyzing each component of the index highlights the strengths and weaknesses of the Trump economy. Stock values, measured by the monthly close in the S&P 500 index, are up about 15% from one year ago. That has contributed to a substantial wealth boost for people who own stocks.
Overall employment and real income, adjusted for inflation, are barely above year-ago levels. And the trend has been weakening in recent months. Job growth in 2024 averaged 168,000 new jobs per month. In 2025, that fell to just 49,000 new jobs per month. During the last three months of 2025, the economy lost 67,000 jobs.
[More: Let’s grade Trump’s affordability plans]
The jobs data for January was due February 6, but has been delayed by the government shutdown that began January 30.
Real income, adjusted for inflation, has been slowing as well, mainly because of elevated inflation and a decline in hours worked. The latest income data comes from the third quarter of 2025 and there won’t be any data for the fourth quarter, because of the six-week shutdown last fall. If inflation ticks up from the current 2.7%, real income growth could turn negative once the first batch of numbers for 2026 comes out in a couple of months.

Home affordability, as measured by the Atlanta Federal Reserve, has improved slightly compared with levels of one year ago. That’s mainly because of a slight decline in mortgage rates. While better than one year ago, the median-priced home is still way beyond the affordability threshold, according to the Atlanta Fed’s data. It takes 43% of median income to pay for a typical home nationwide; 30% is the target for affordability.
[More: How to survive America in 2026]
These numbers elucidate the so-called K-shaped economy, with a big divergence between those getting ahead and those falling behind. The upper slant of the K represents people who own enough stock to benefit from the “wealth effect” of a rising market, and who are insulated from housing affordability challenges. That generally means people who bought a home before the 2020 Covid pandemic and have since benefited from soaring home values and the ability to refinance their mortgages at record low interest rates.
On the lower slant of the K are people with minimal financial wealth who are grappling with housing costs that have risen by more than incomes during the last five years. They could be renters or families who bought a home recently and have to devote a much bigger chunk of their paycheck to housing costs than owners who locked in super-low rates a few years ago.
[More: Your 5-step guide to the next Trump crisis]
Trump promised voters in 2024 that he would make life more affordable, but the charts above show that the trends since Trump took office aren’t so rosy. Trump’s approval rating has slumped, especially on his handling of the economy. Republicans fear that will mean big losses in the November midterm elections.
The tax cut law Trump signed last July will help Americans this year. The Tax Foundation estimates it will save the typical household about $1,000 on average. But the biggest savings will go to higher earners already on the upper arm of the K-shaped economy. Lower earners might not notice much of a difference.
Trump has also outlined a bevy of ideas for lowering the cost of housing, food, energy and health care. But most of his plans are vague and there’s not a lot he can do that voters will notice anytime soon. The K-shaped economy will be here for a while.
It is all right to call it a K shaped economy but' if it were me i would call it a economy were the rich get richer an the poor get poorer.I said it before the baby boomers are really the only reason this economy is not going south in a hurry.Believe me a government run with only Chaos as a rule of thumb will not work an you loose a lot of allies.
You jumped the gun on this article (I just saw that the latest jobs data was released this afternoon). I am starting to get worried with the job losses. So far, the market is beating up Tech stocks and bit coin, but the attention may soon turn to job losses and unemployment. I'll be looking forward to next month's Better-Off index.