

The Better-Off Barometer
Do you feel like you're getting ahead or falling behind? See if our data backs you up.

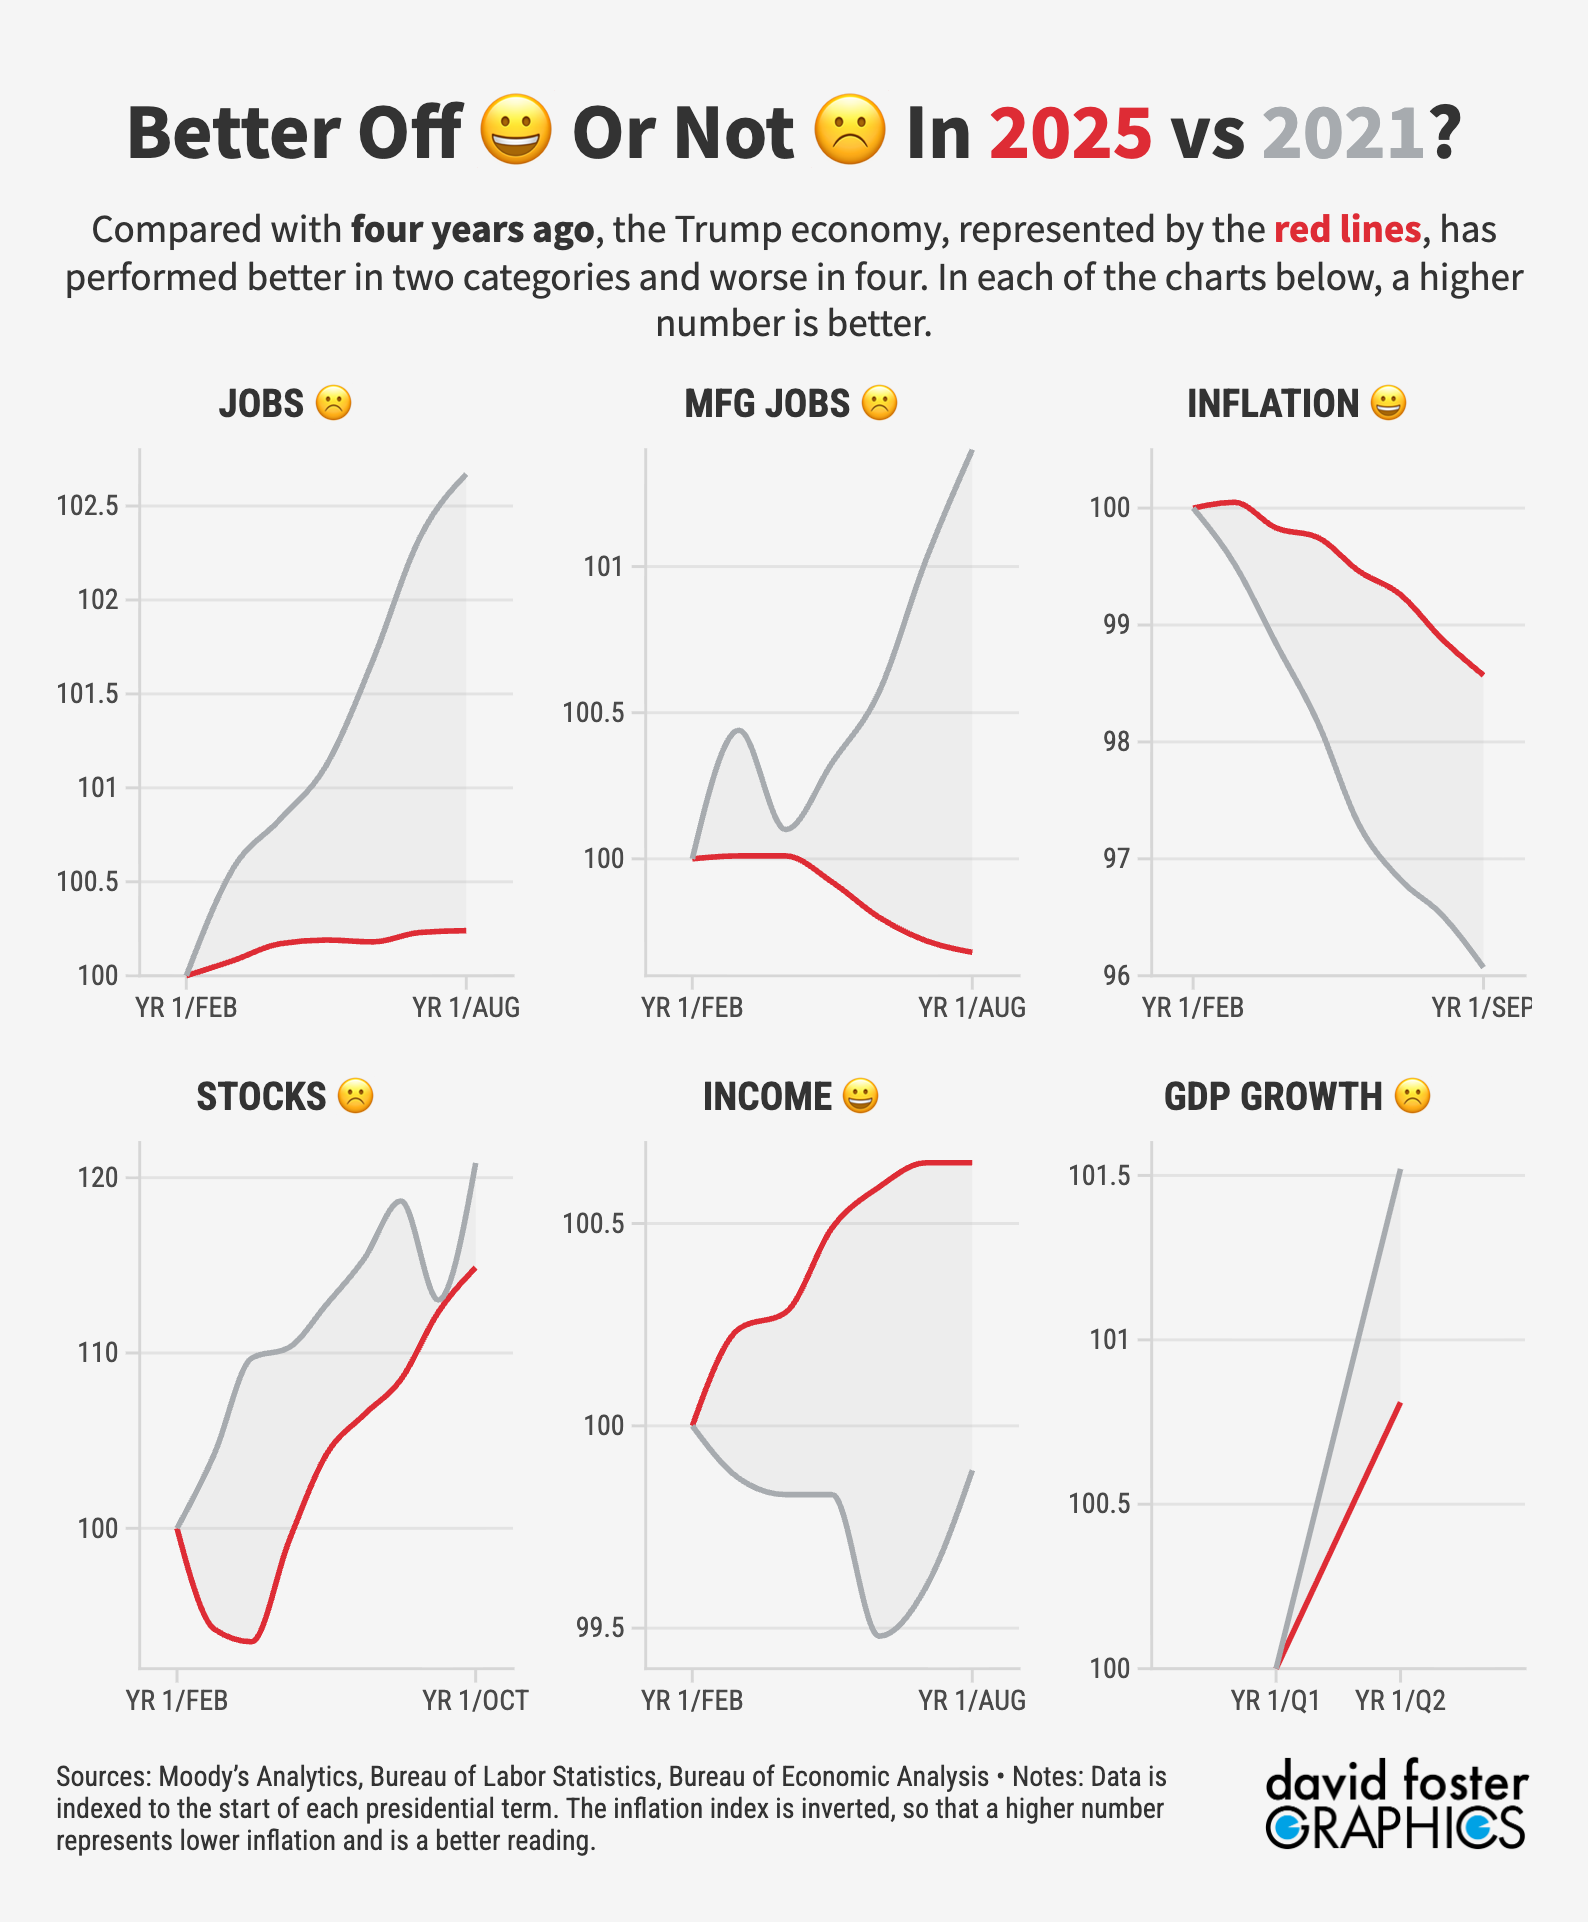
In the 1980 presidential campaign, challenger Ronald Reagan famously asked voters, “are you better off than you were four years ago?” Voters decided they weren’t, electing Reagan over the incumbent, Jimmy Carter.
Ever since, that question about progress has been shorthand for whether politicians are getting the job done. We decided to plug some numbers into the debate. The Rick Report is tracking the Trump economy on six key metrics, compared with prior presidents going back to Carter in the 1970s, at the same point in each presidential term. Moody’s Analytics provides the data, which you can see on our Trumponomics Dashboard. Graphics guru David Foster creates the data visualization. We update the numbers monthly as new data on jobs, inflation, incomes, stock values, and GDP growth becomes available.
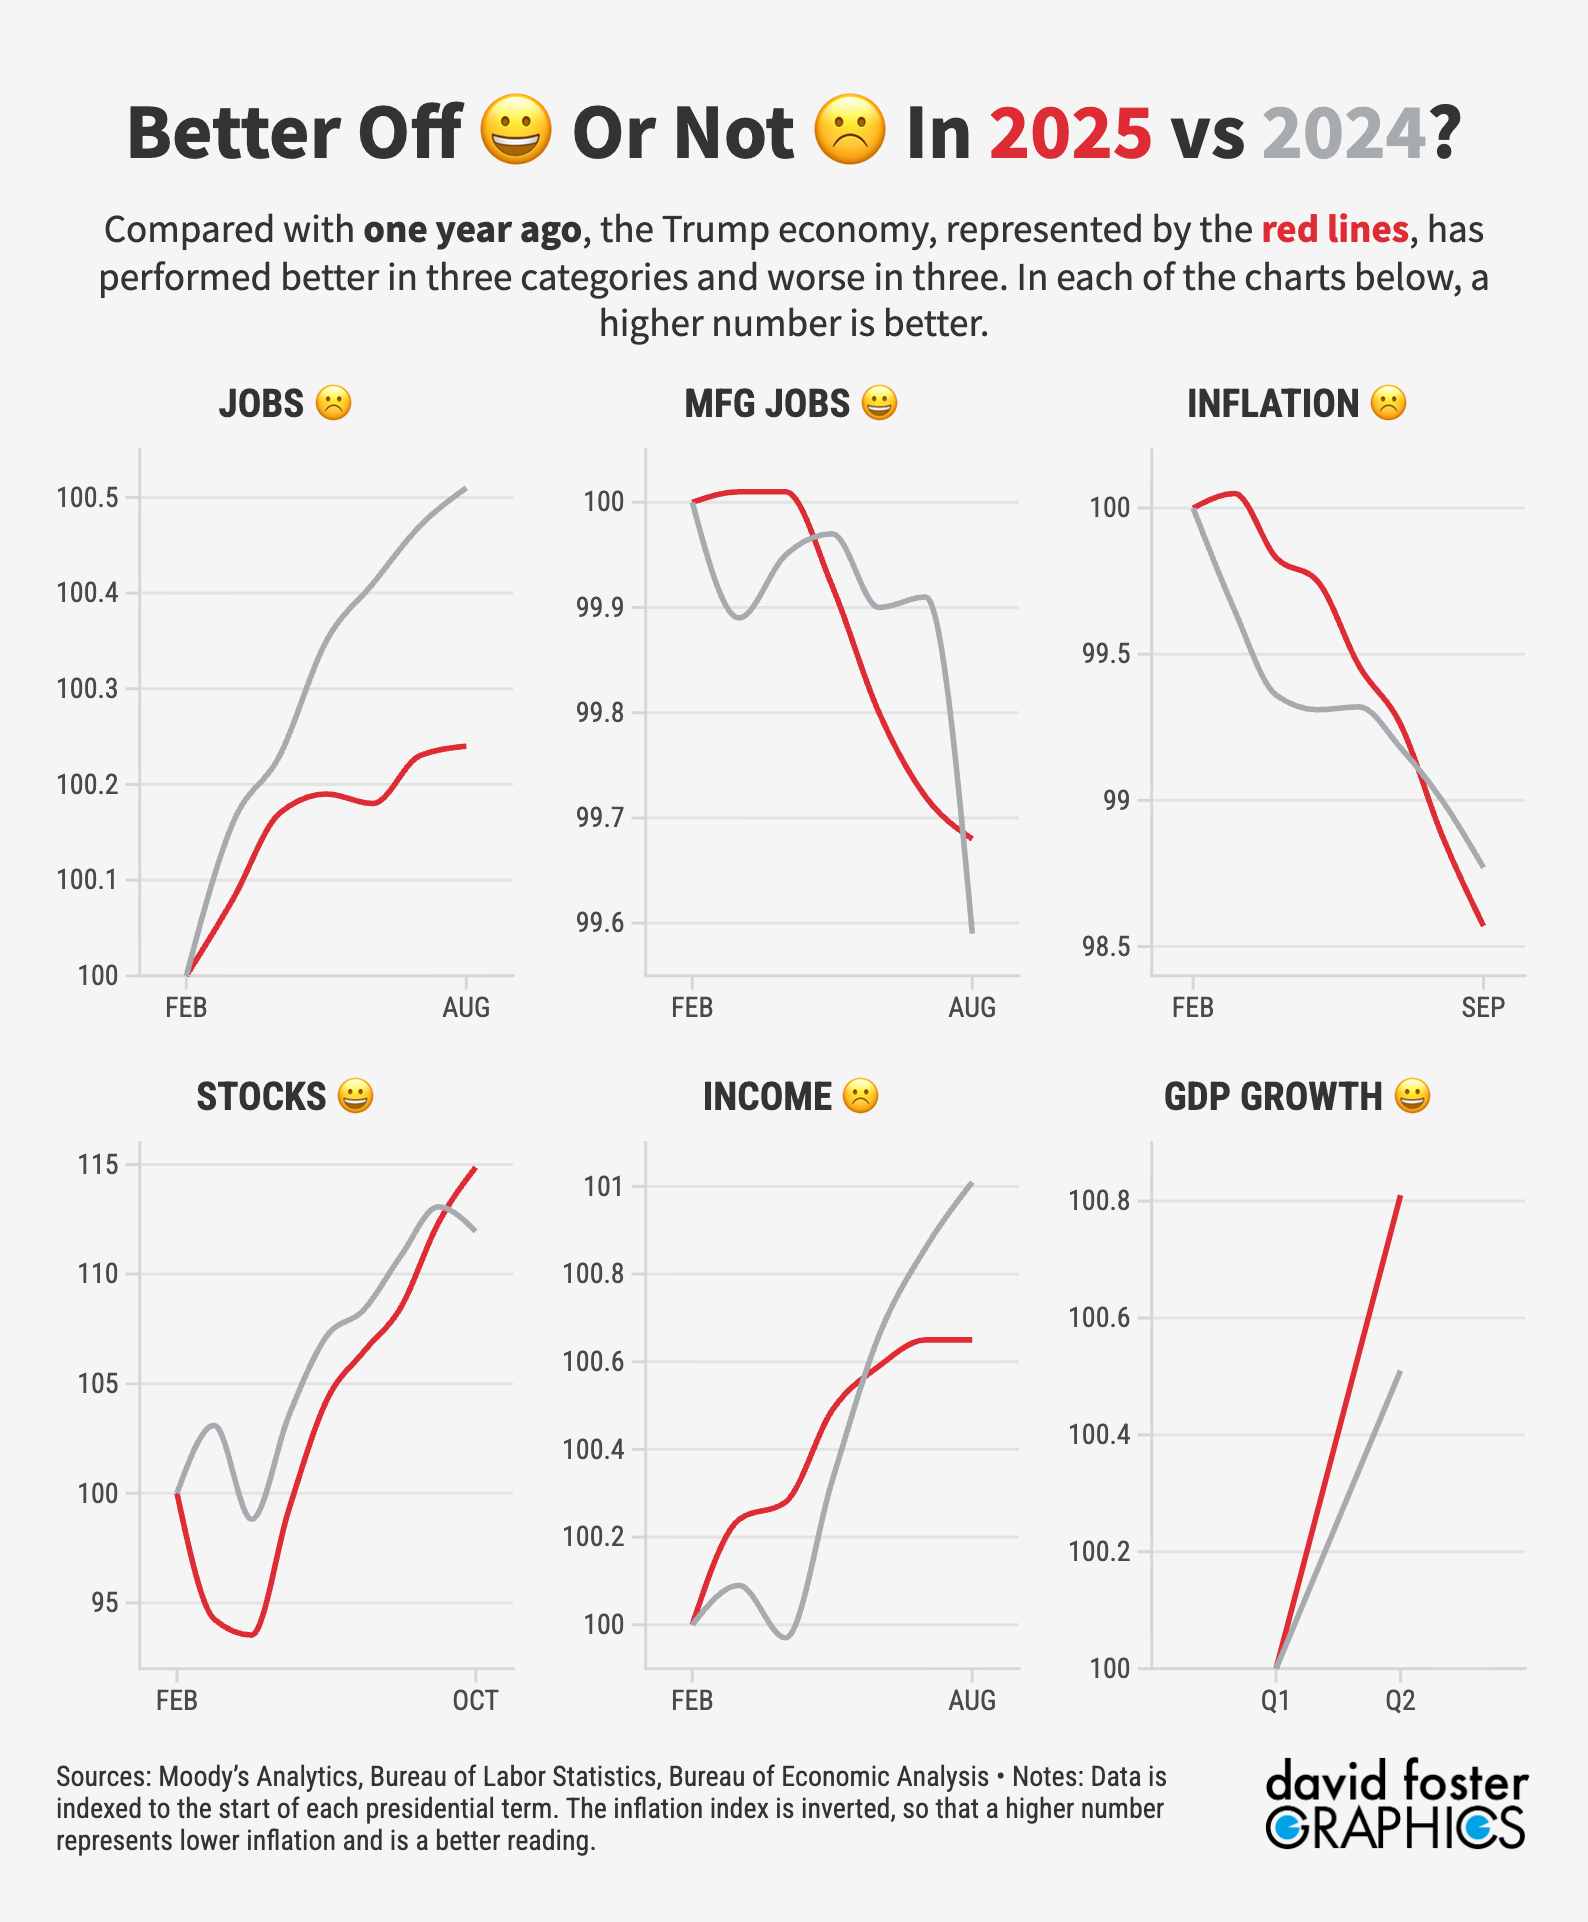
The Better-Off Barometer uses that data to assess the state of the economy compared with the way it was four years ago, in the spirit of Reagan’s formulation. Voters might find that type of comparison most useful around the time of elections.
We also do a one-year comparison, which is more like the way ordinary people might measure their well-being on an ongoing basis.
You’ll see these better-off comparisons used throughout The Rick Report, as we provide continual insights on the state of the economy and who’s up or down. You can bookmark this page to see thumbnails of the latest data, or visit the interactive version maintained by David Foster. We always welcome feedback on how to make our projects better, in the comments below or directly via email.
~ ~ ~ ~ ~ ~ ~ ~ ~ ~
~ ~ ~ ~ ~ ~ ~ ~ ~ ~
How is income calculated? Would high end earners skew this?